| GWFUP ANALYSIS REPORT FOR GW S250908y |
|
|
|
| SUMMARY | |
| Name | S250908y |
| Trigger MET | 779034873.95 |
| Date | 2025-09-08 |
| Time | 14:34:28 |
| In SAA? | False |
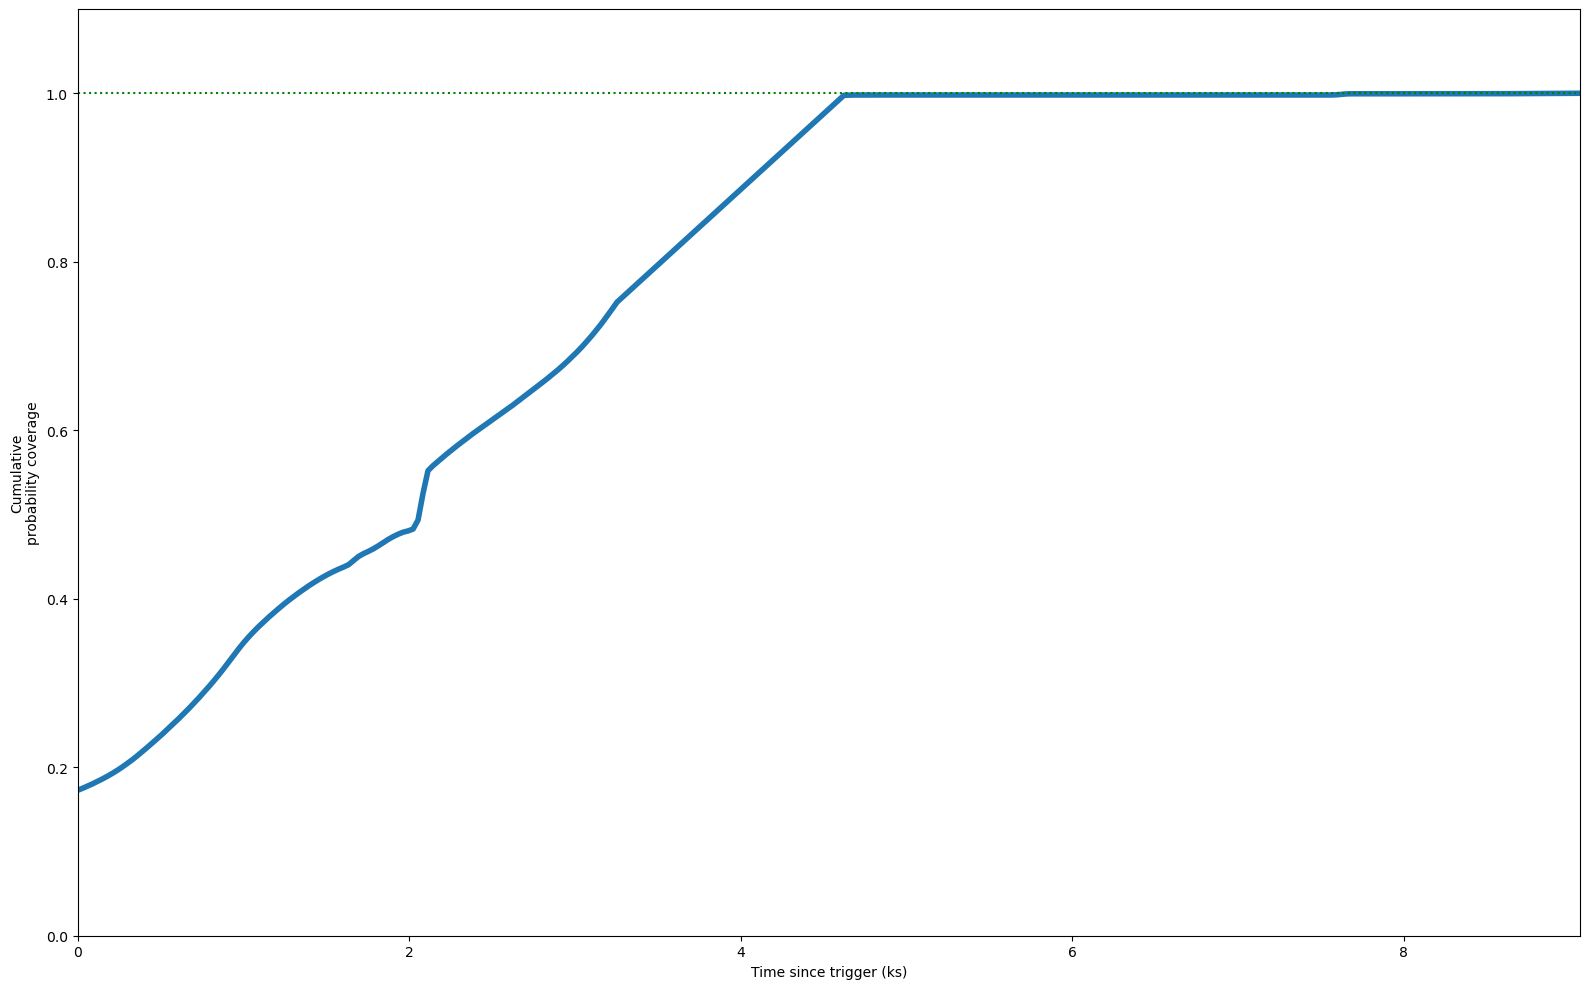
| Inst Coverage | 17.3% |
| T Max Coverage | 9.1 ks (100.0%) |
| E Min | 100.0 MeV |
| E Max | 100000.0 MeV |
| T Start | 0.0 s |
| T Stop | 10000.0 s |
| Theta Max | 65.0° |
| Z Max | 100.0° |
| ROI | 8.0° |
| IRF | p8_source |
| Galactic Model | template |
| Strategy | time |
| Particle Model | isotr template |
| NSide | 64 |
| Version | v02 |
|
| COVERAGE |
|
|
| FIXED TIME INTERVAL ANALYSIS |
|
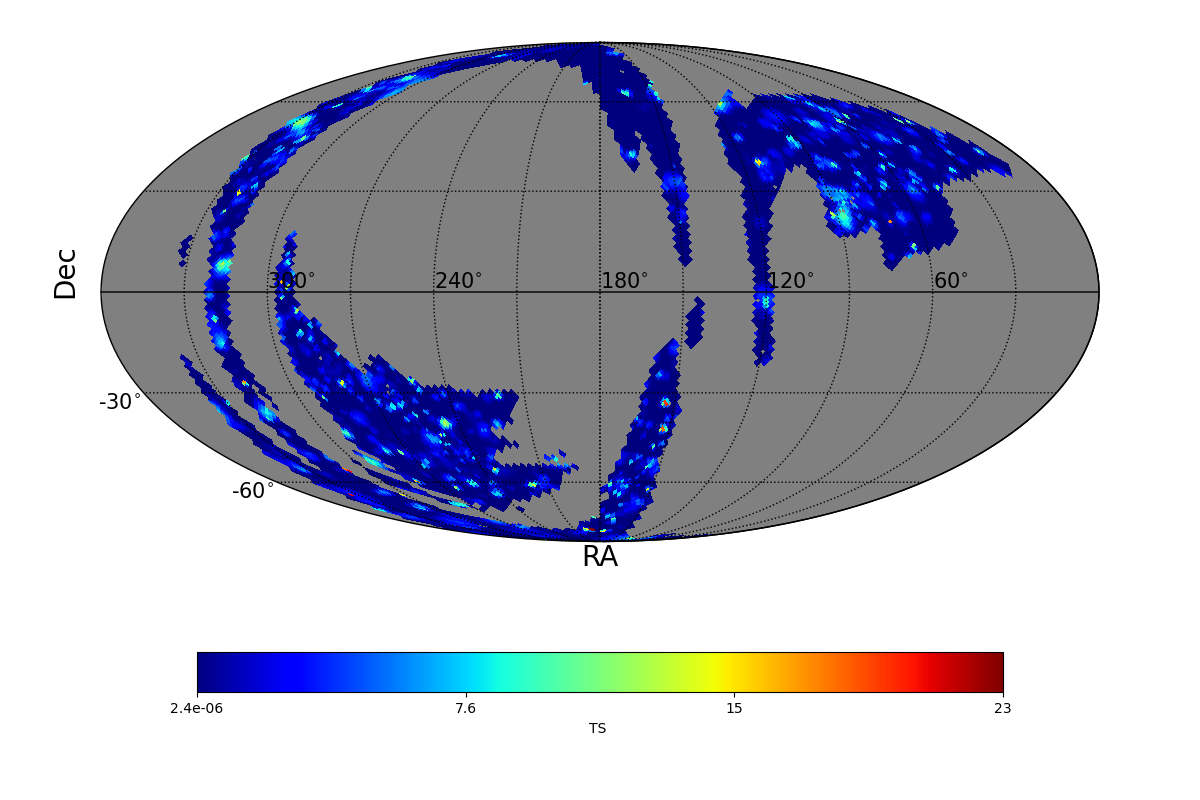
| TS MAXIMUM |
|---|
|
TS = 22.6 |
Ra | 190.38° |
| Dec | -80.49° |
| Nearby 4FGL sources | 0 |
| Sun in this pixel? | False |
| Moon in this pixel? | False |
| LIST OF OTHER TS > 25.0 |
|---|
|
| TS MAP |

|
|
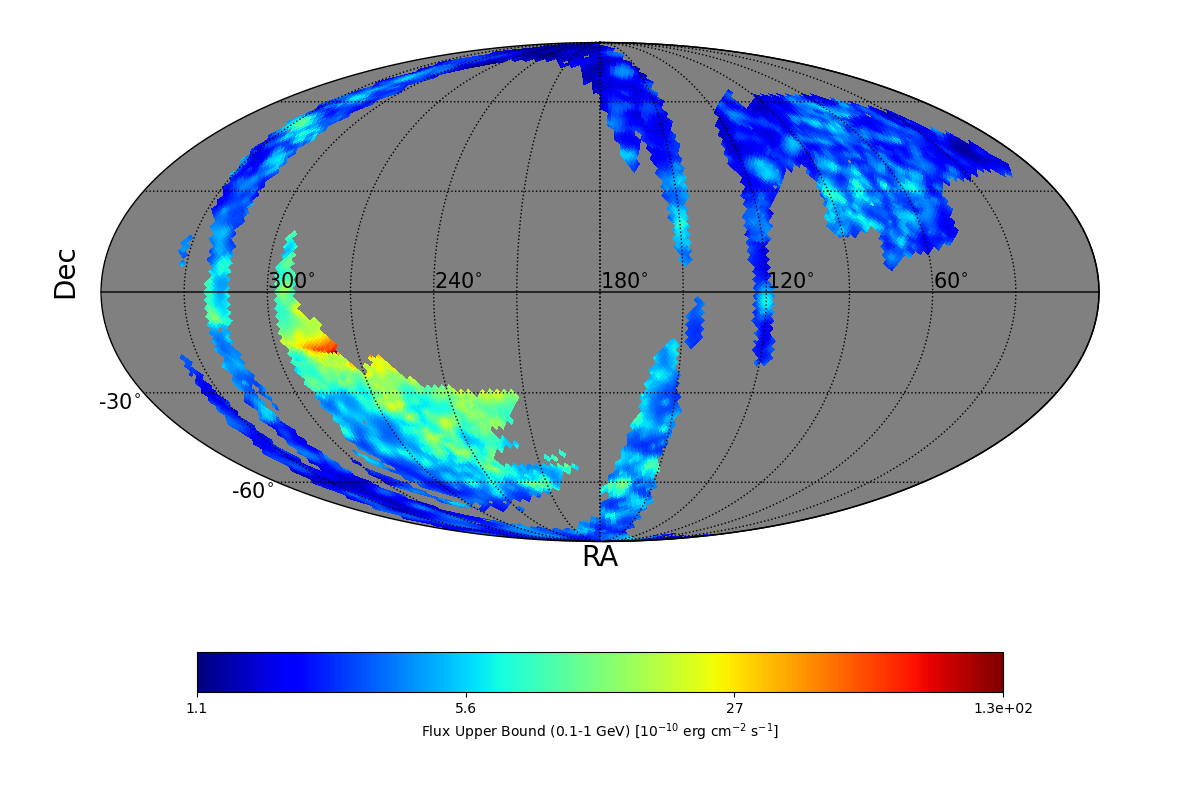
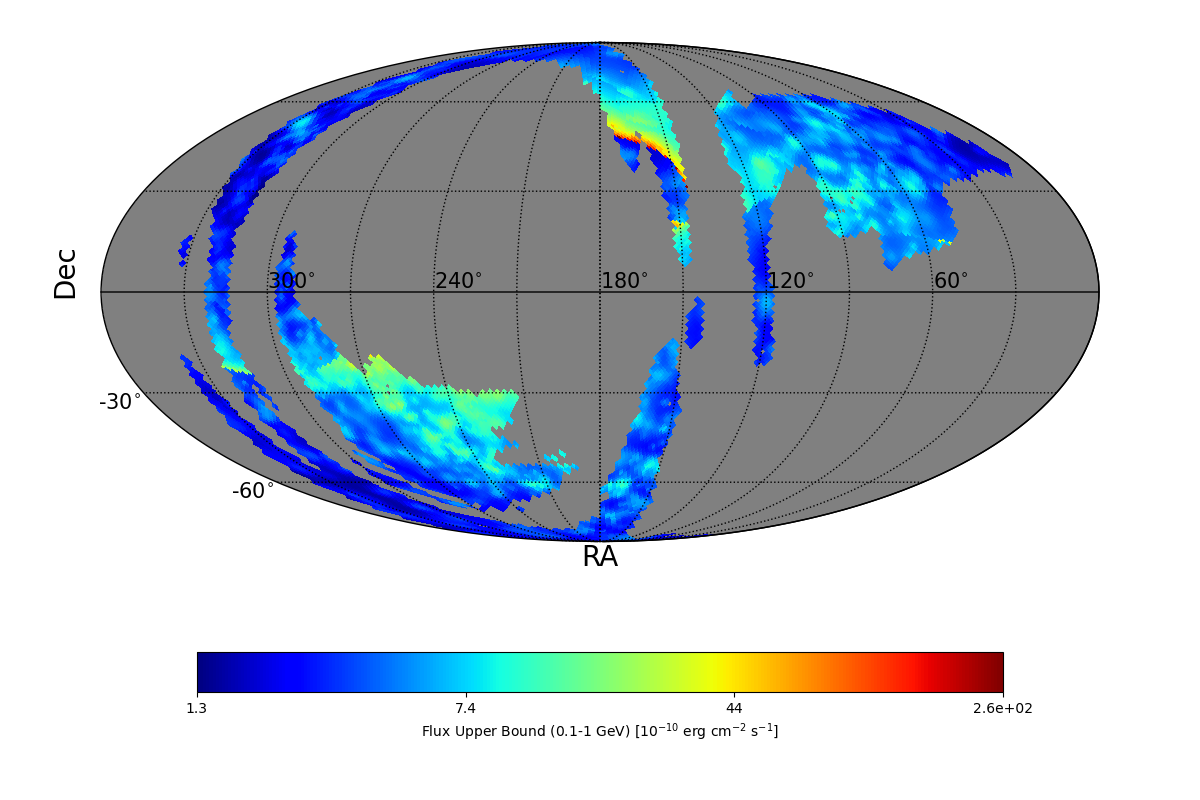
| FLUX UB EXTREMES |
| UB min | 1.15 e-10 erg cm-2 s-1 |
| UB max | 13.0 e-9 erg cm-2 s-1 |
| BAYESIAN FLUX UB (CL=95%) |
| Photon flux | 16.44 e-7 ph cm-2 s-1 |
| Energy flux | 7.93 e-10 erg cm-2 s-1 |
|
| UL MAP |
|
|
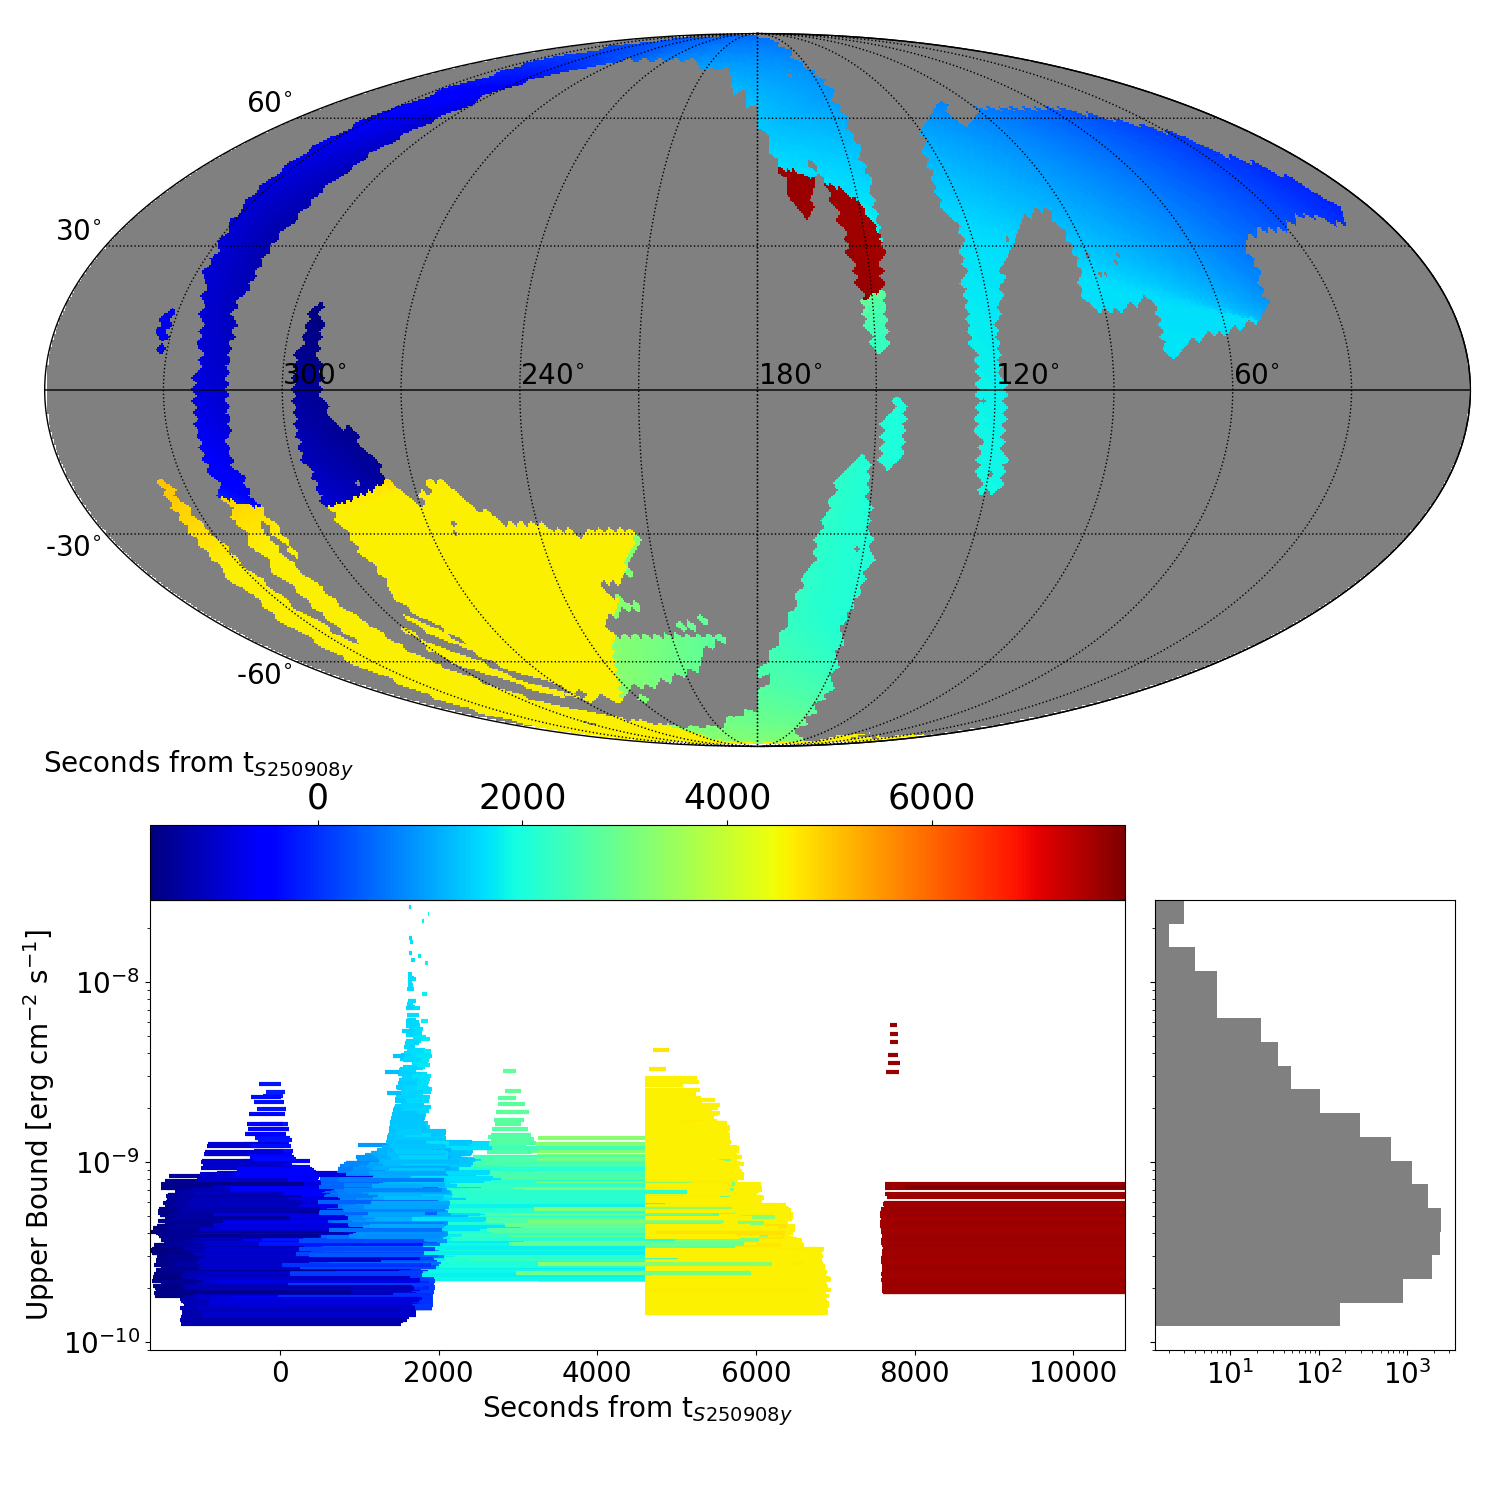
| ADAPTIVE TIME INTERVAL ANALYSIS |
|
|
|
DISTRIBUTION OF THE UPPER BOUNDS |
|
|
| TS MAXIMUM |
|---|
|
TS = 22.7 |
Ra | 190.38° |
| Dec | -80.49° |
| Nearby 4FGL sources | 0 |
| Sun in this pixel? | False |
| Moon in this pixel? | False |
| LIST OF OTHER TS > 25.0 |
|---|
|
|
TS MAP |
|
|
| FLUX UB EXTREMES |
| UB min | 1.26 e-10 erg cm-2 s-1 |
| UB max | 25.9 e-9 erg cm-2 s-1 |
|
|
UL MAP |
|
|
|
|
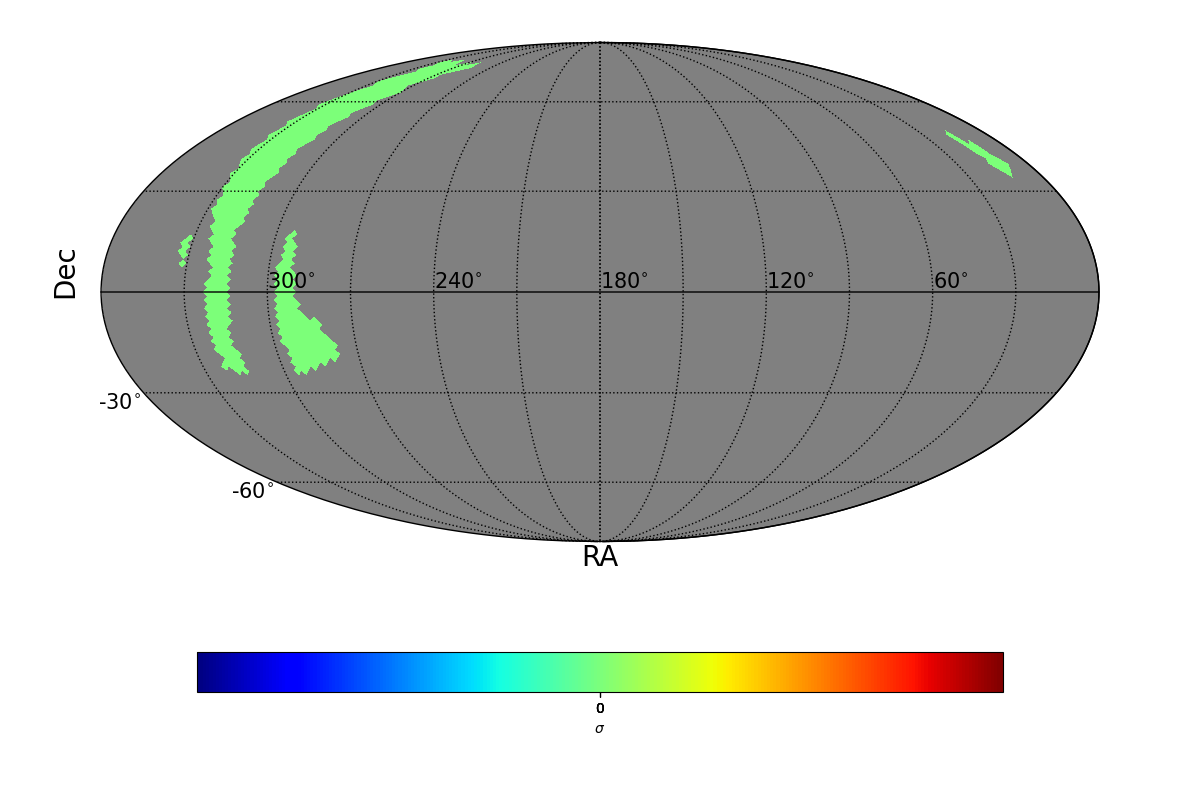
| SIGMA MAXIMUM |
|---|
|
SIGMA = 0.0 |
Ra | 315.0° |
| Dec | 76.81° |
| Nearby 4FGL sources | 3 |
| 4FGL J2105.9+7508 | Δ=1.7° |
| 4FGL J2108.7+7532 | Δ=1.38° |
| 4FGL J2122.3+7653 | Δ=1.27° |
| Sun in this pixel? | False |
| Moon in this pixel? | False |
| LIST OF OTHER SIGMA > 4 |
|---|
|
|
SIGMA MAP |
|
|
|
|
|
|
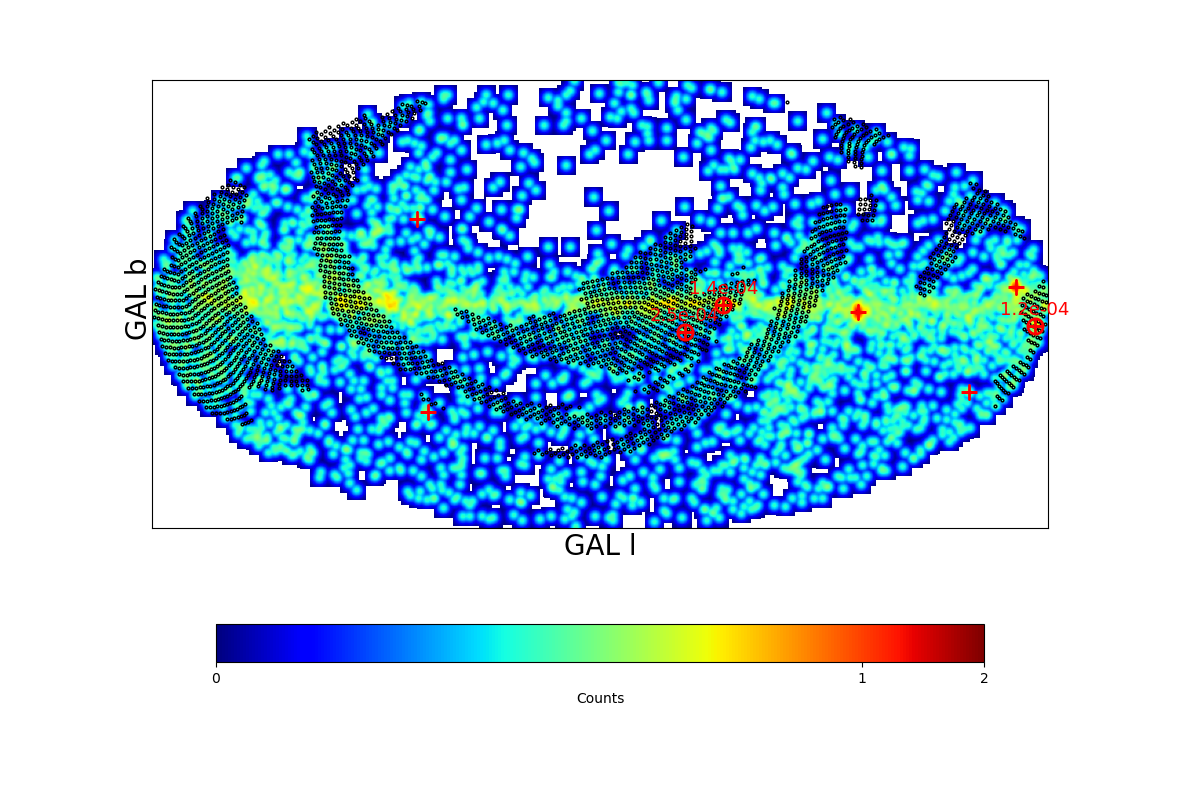
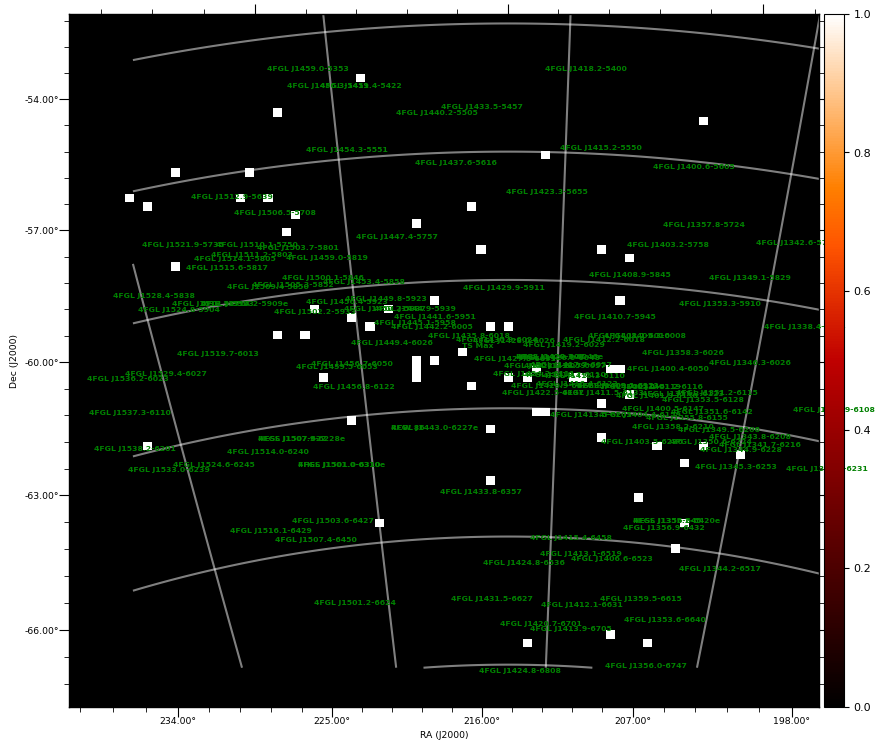
COUNT MAP |
|
|
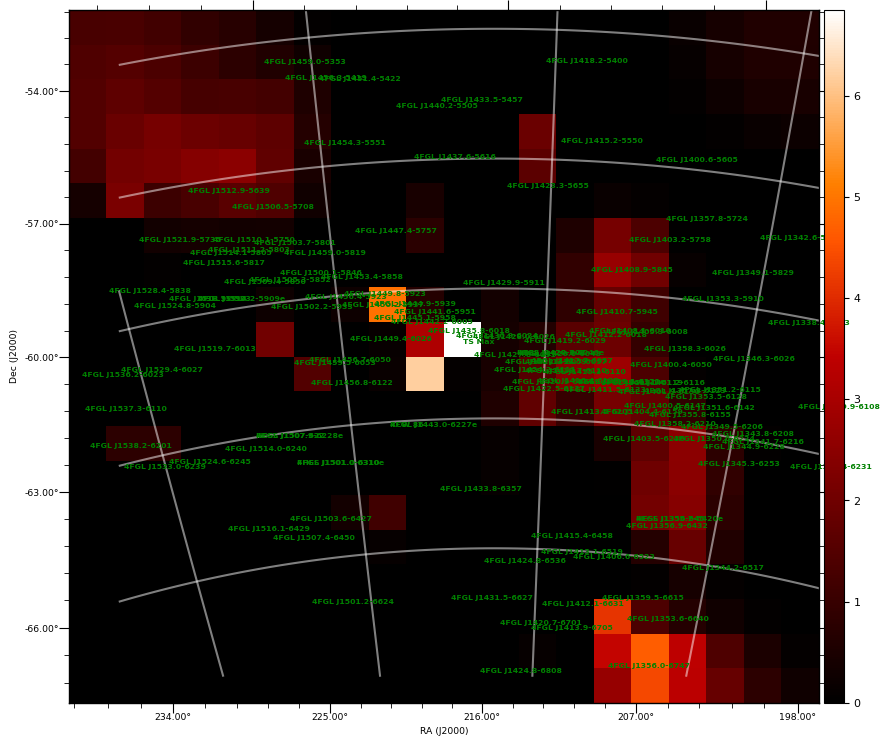
| TS MAXIMUM |
|---|
|
TS = 6.9 |
Ra | 217.47° |
| Dec | -60.56° |
| Nearby 4FGL sources | 5 |
| 4FGL J1424.2-6111 | Δ=0.94° |
| 4FGL J1427.8-6051 | Δ=0.39° |
| 4FGL J1428.0-6026 | Δ=0.25° |
| 4FGL J1430.9-6024 | Δ=0.2° |
| 4FGL J1435.8-6018 | Δ=0.78° |
| Sun in this pixel? | False |
| Moon in this pixel? | False |
|
|
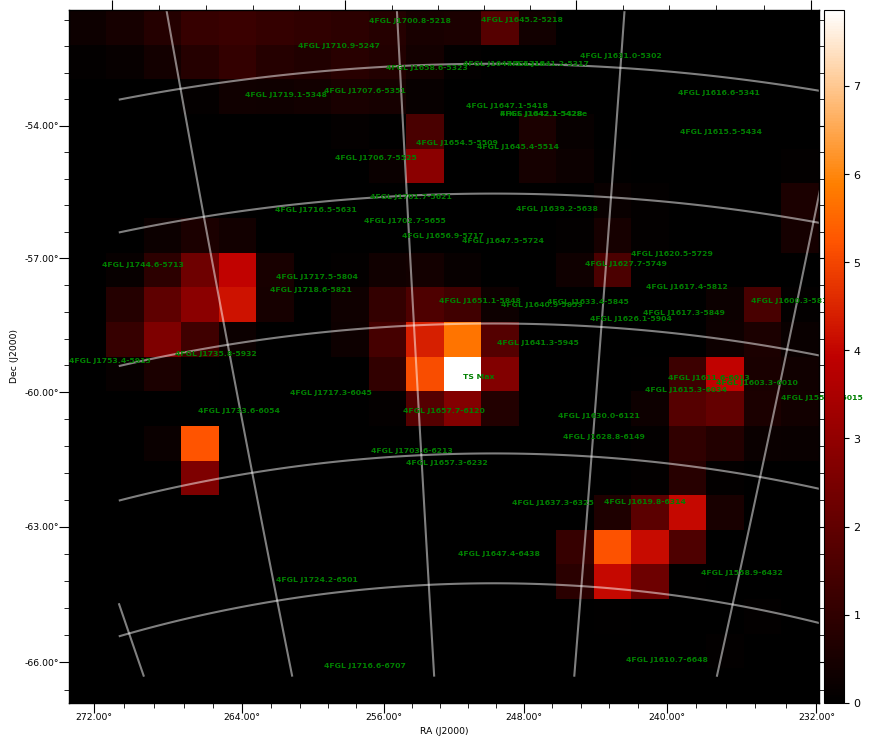
TS MAP |
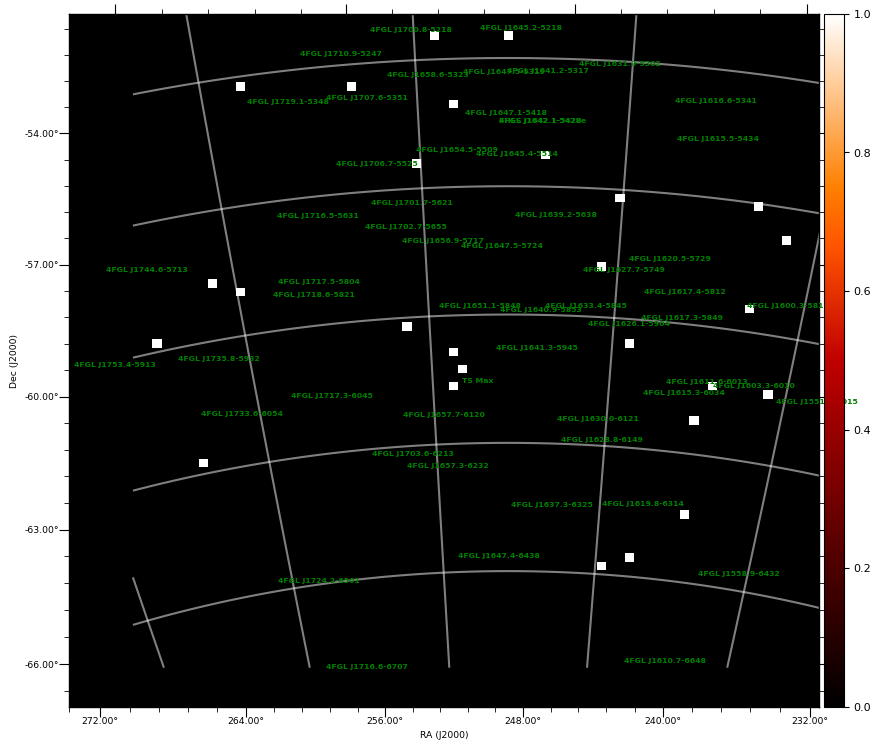
COUNT MAP |
|
|
|
| TS MAXIMUM |
|---|
|
TS = 7.9 |
Ra | 251.78° |
| Dec | -60.55° |
| Nearby 4FGL sources | 0 |
| Sun in this pixel? | False |
| Moon in this pixel? | False |
|
|
TS MAP |
COUNT MAP |
|
|
|
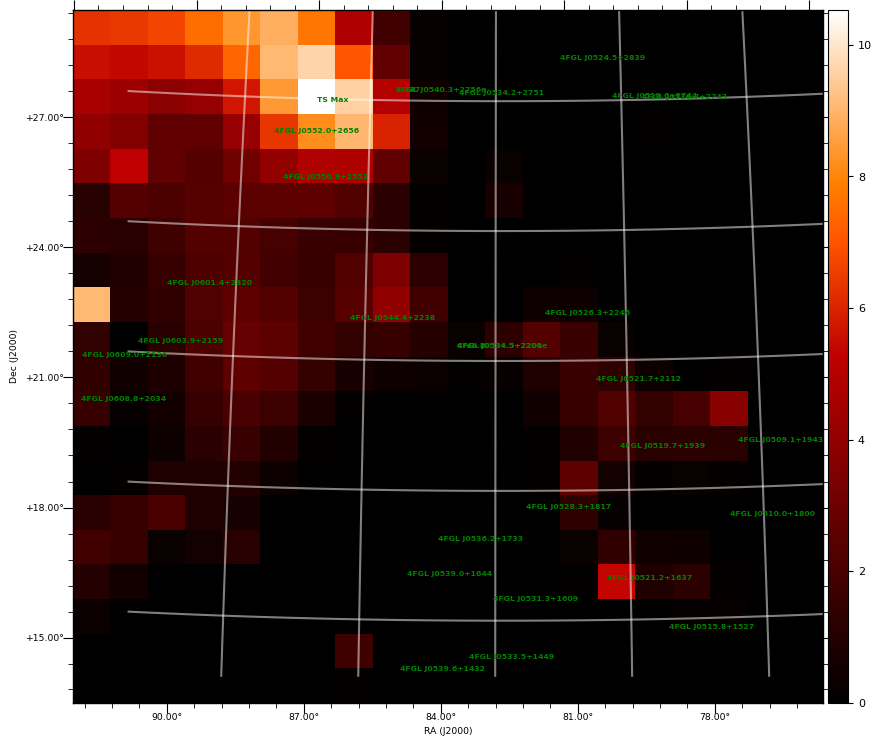
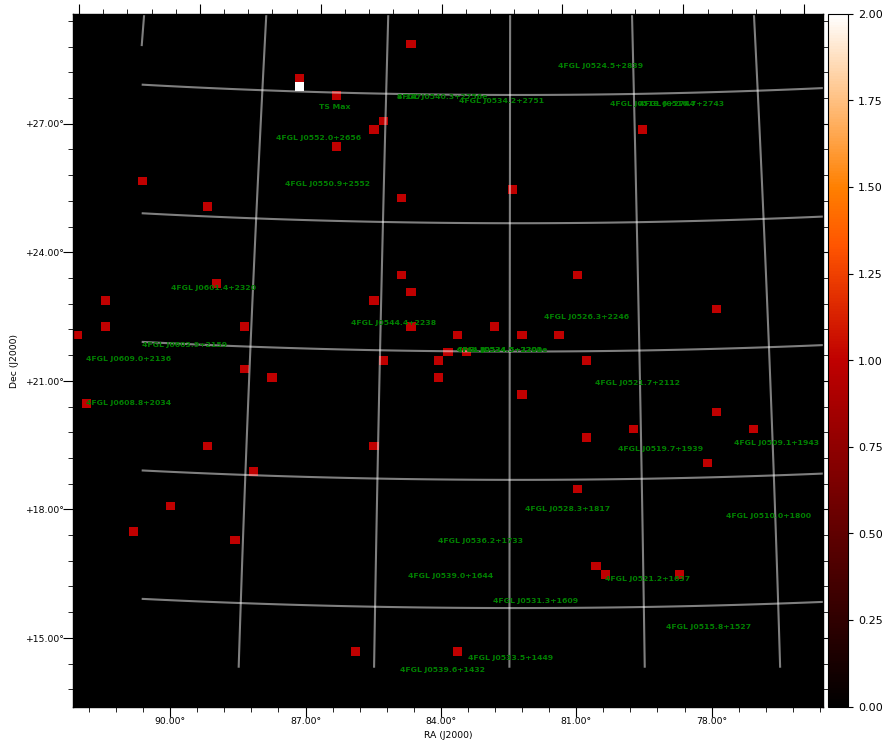
| TS MAXIMUM |
|---|
|
TS = 10.5 |
Ra | 87.0° |
| Dec | 27.68° |
| Nearby 4FGL sources | 0 |
| Sun in this pixel? | False |
| Moon in this pixel? | False |
|
|
TS MAP |
COUNT MAP |
|
|
|
|
|