| GWFUP ANALYSIS REPORT FOR GW S241230bd |
|
|
|
| SUMMARY | |
| Name | S241230bd |
| Trigger MET | 757241109.53 |
| Date | 2024-12-30 |
| Time | 08:45:04 |
| In SAA? | True |
| Inst Coverage | 4.8% (0.9 ks) |
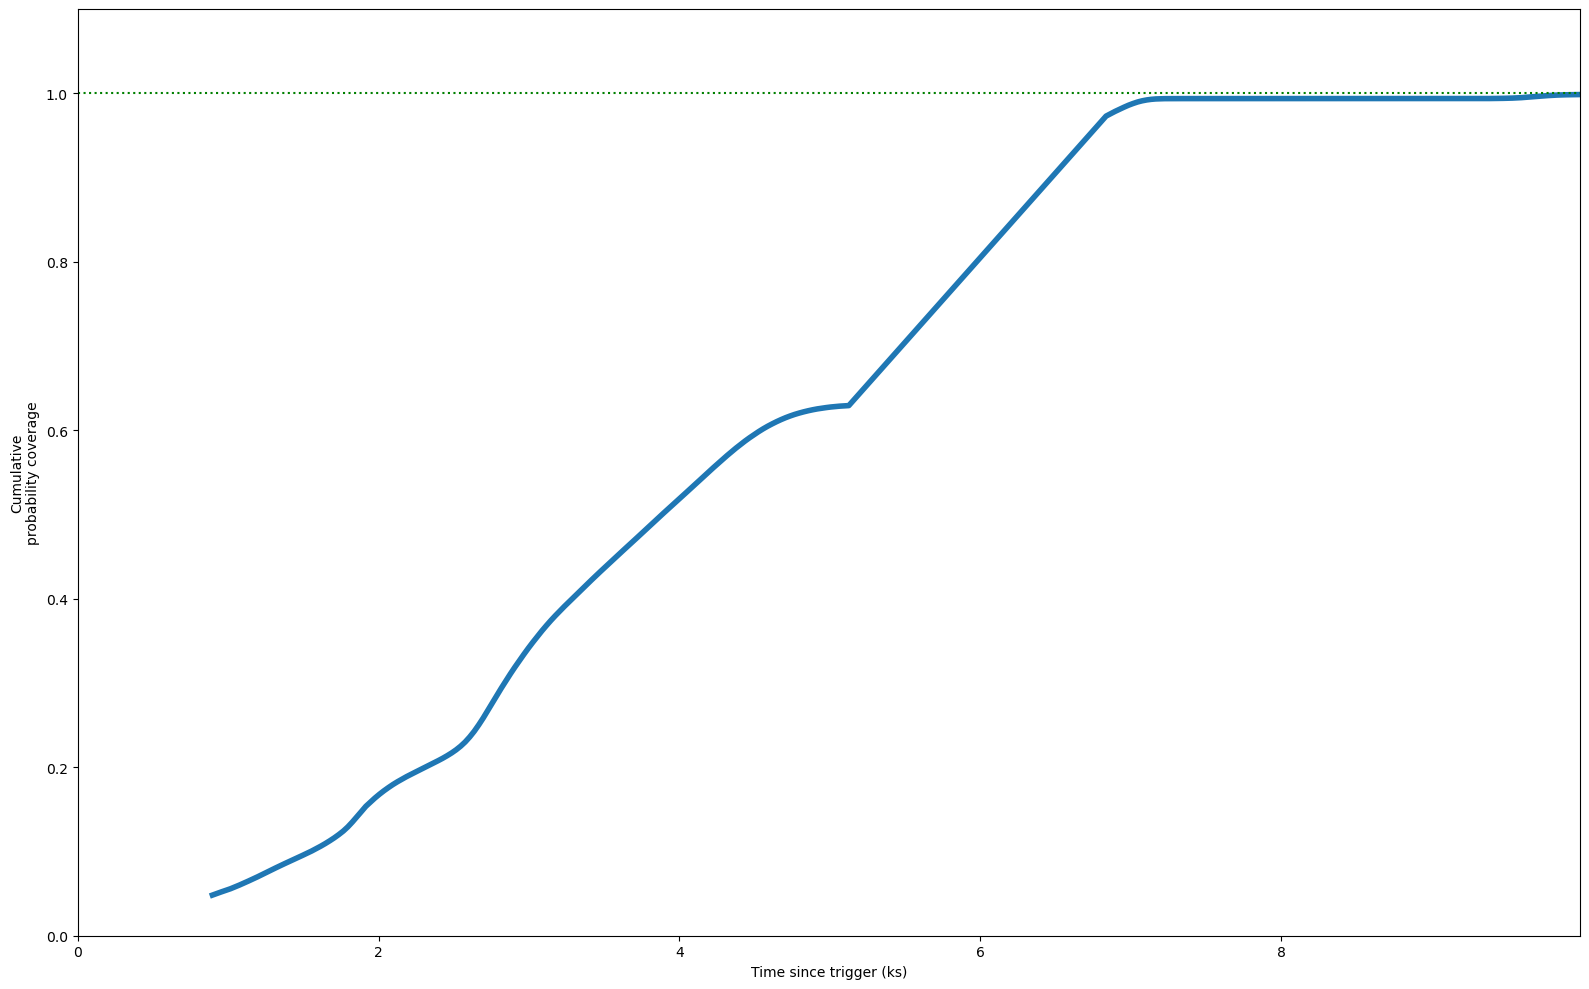
| T Max Coverage | 10.0 ks (99.84%) |
| E Min | 100.0 MeV |
| E Max | 100000.0 MeV |
| T Start | 0.0 s |
| T Stop | 10000.0 s |
| Theta Max | 65.0° |
| Z Max | 100.0° |
| ROI | 8.0° |
| IRF | p8_source |
| Galactic Model | template |
| Strategy | time |
| Particle Model | isotr template |
| NSide | 64 |
| Version | v02 |
|
| COVERAGE |
|
|
| FIXED TIME INTERVAL ANALYSIS |
|
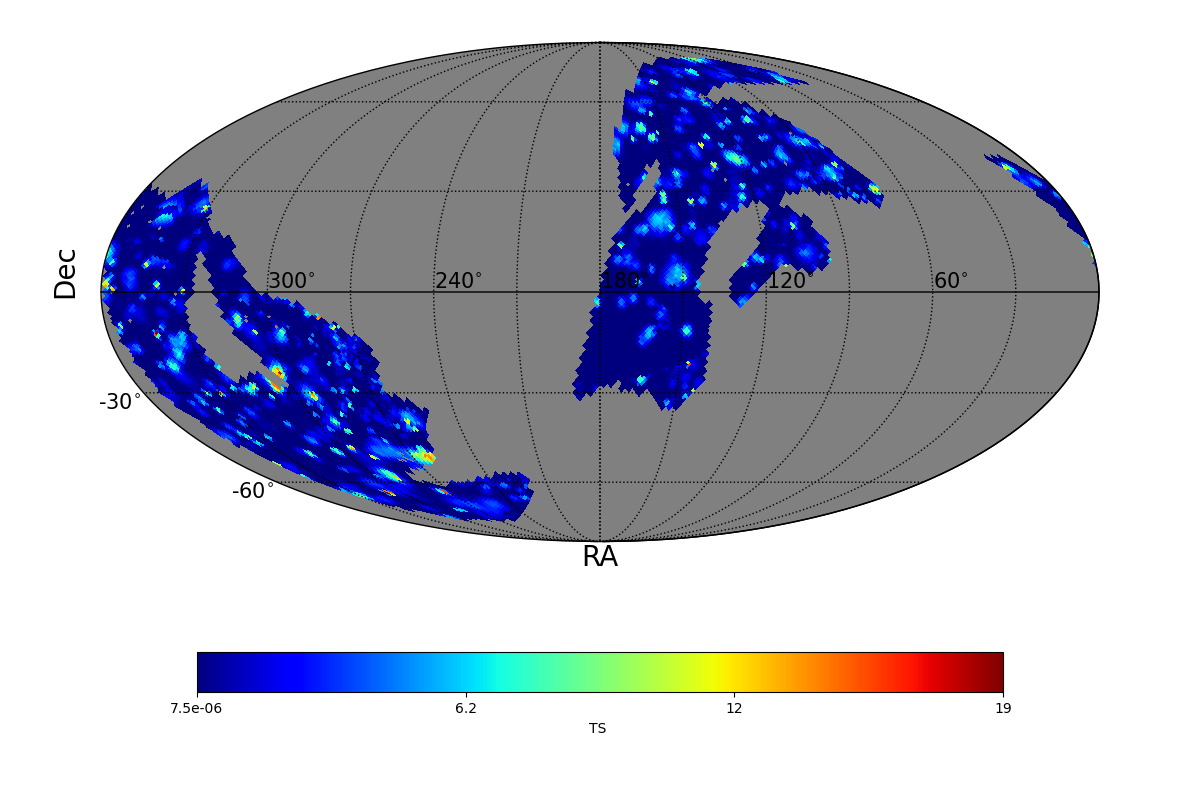
| TS MAXIMUM |
|---|
|
TS = 18.5 |
Ra | 342.42° |
| Dec | -12.02° |
| Nearby 4FGL sources | 2 |
| 4FGL J2246.5-1204 | Δ=0.77° |
| 4FGL J2250.0-1250 | Δ=0.83° |
| Sun in this pixel? | False |
| Moon in this pixel? | False |
| LIST OF OTHER TS > 25.0 |
|---|
|
| TS MAP |

|
|
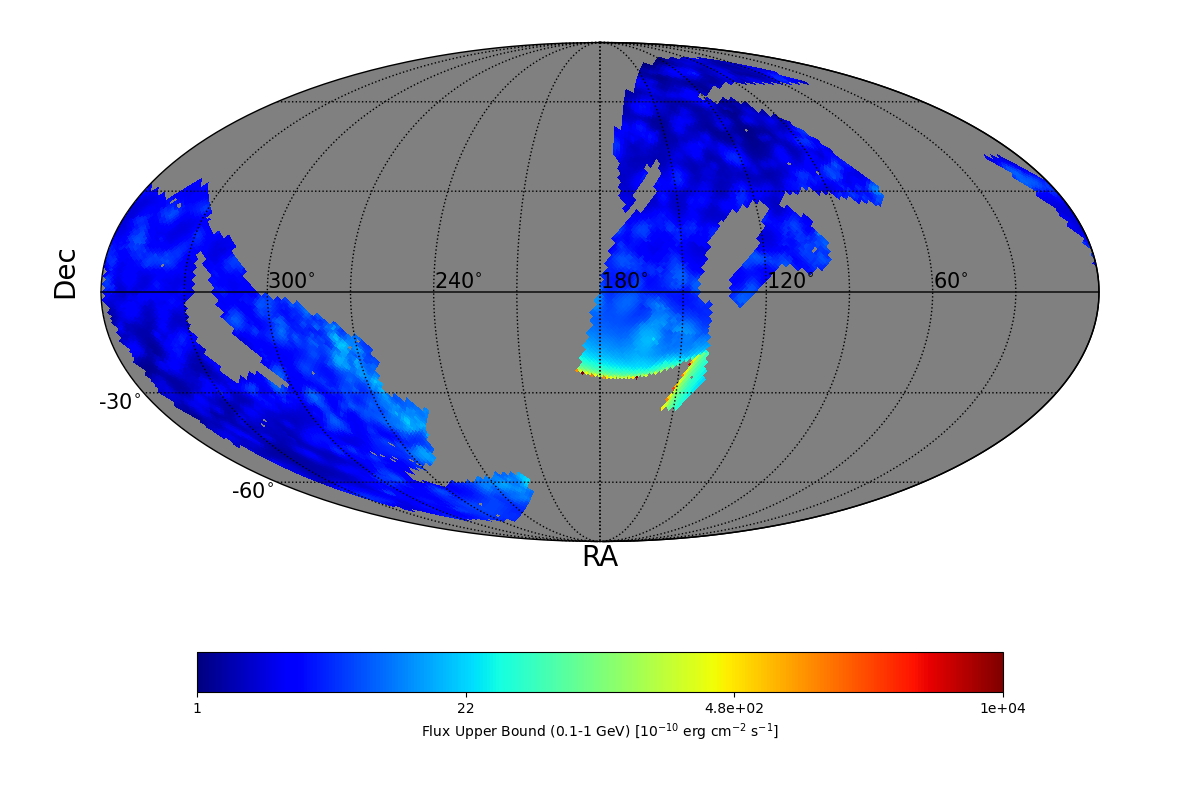
| FLUX UB EXTREMES |
| UB min | 1.04 e-10 erg cm-2 s-1 |
| UB max | 1020.0 e-9 erg cm-2 s-1 |
| BAYESIAN FLUX UB (CL=95%) |
| Photon flux | 16.67 e-7 ph cm-2 s-1 |
| Energy flux | 6.81 e-10 erg cm-2 s-1 |
|
| UL MAP |
|
|
| ADAPTIVE TIME INTERVAL ANALYSIS |
|
|
|
DISTRIBUTION OF THE UPPER BOUNDS |

|
|
| TS MAXIMUM |
|---|
|
TS = 18.6 |
Ra | 309.86° |
| Dec | -64.2° |
| Nearby 4FGL sources | 0 |
| Sun in this pixel? | False |
| Moon in this pixel? | False |
| LIST OF OTHER TS > 25.0 |
|---|
|
|
TS MAP |
|
|
| FLUX UB EXTREMES |
| UB min | 1.03 e-10 erg cm-2 s-1 |
| UB max | 1020.0 e-9 erg cm-2 s-1 |
|
|
UL MAP |

|
|
|
|
|
|
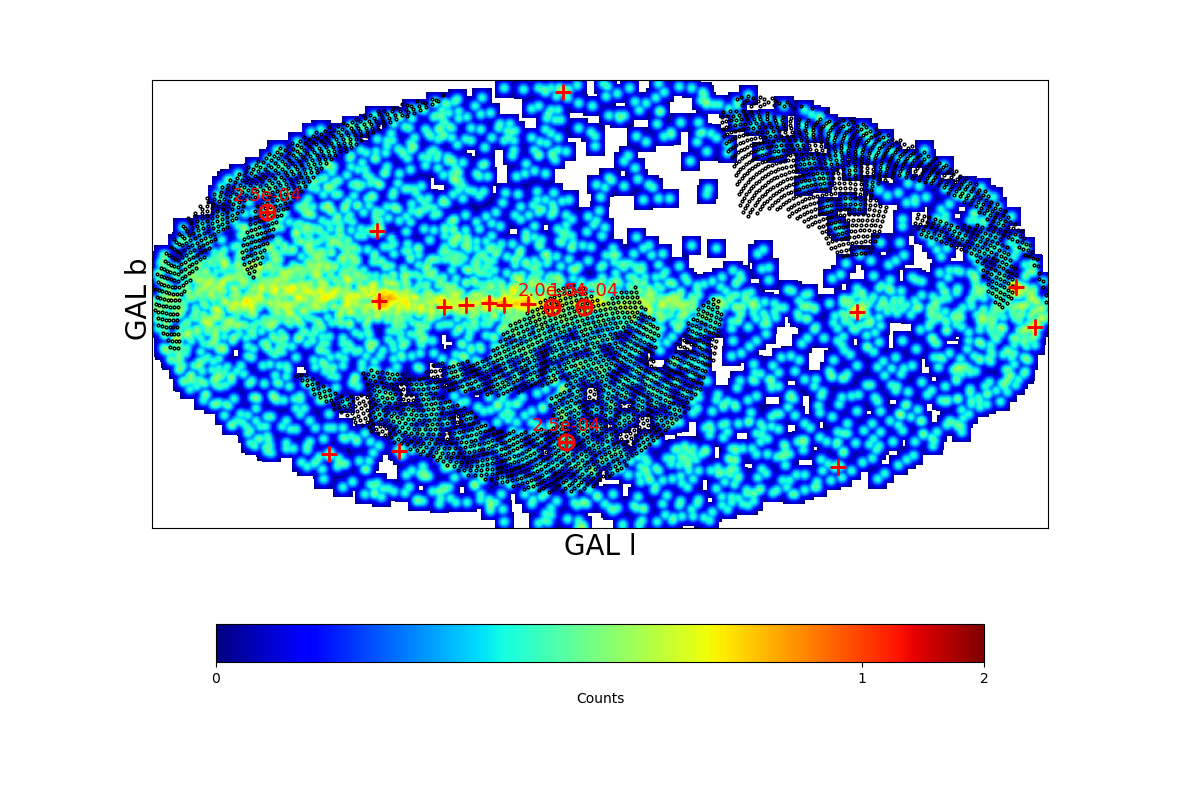
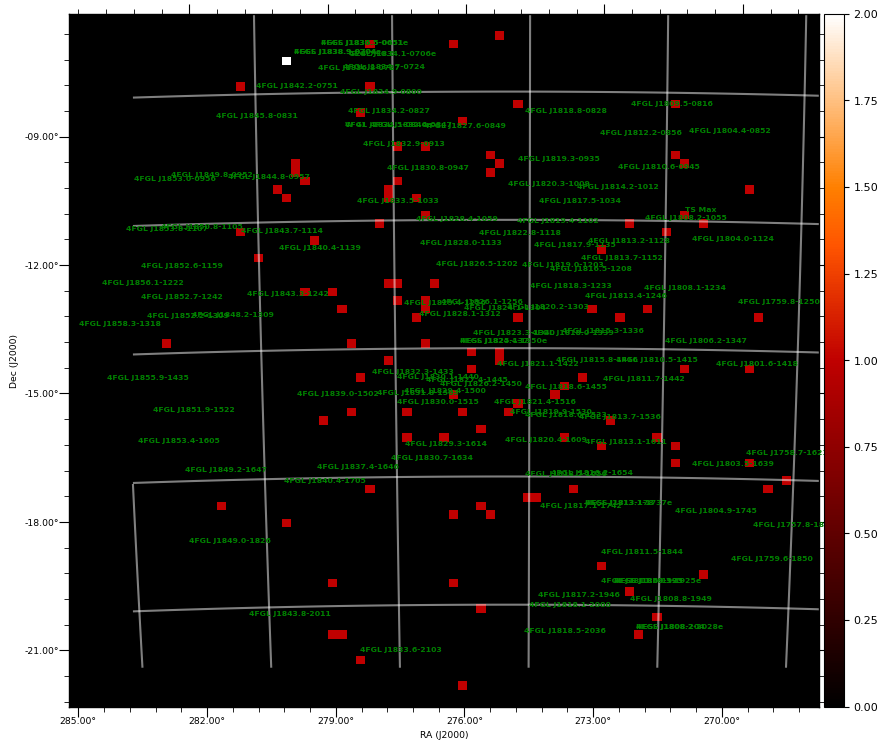
COUNT MAP |
|
|
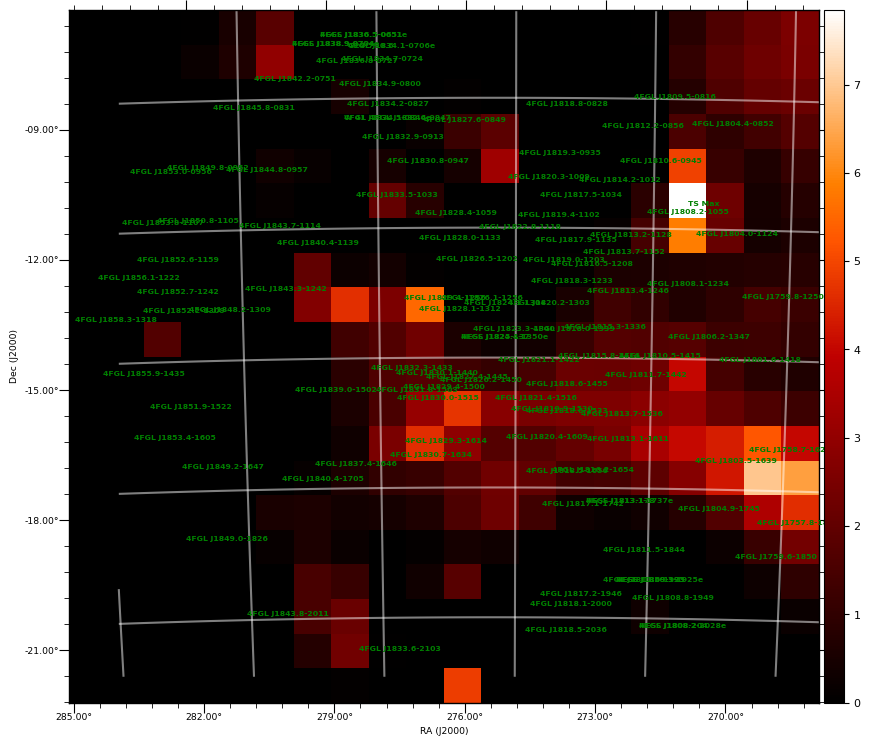
| TS MAXIMUM |
|---|
|
TS = 7.8 |
Ra | 271.19° |
| Dec | -10.71° |
| Nearby 4FGL sources | 2 |
| 4FGL J1804.0-1124 | Δ=0.72° |
| 4FGL J1808.2-1055 | Δ=0.88° |
| Sun in this pixel? | False |
| Moon in this pixel? | False |
|
|
TS MAP |
COUNT MAP |
|
|
|
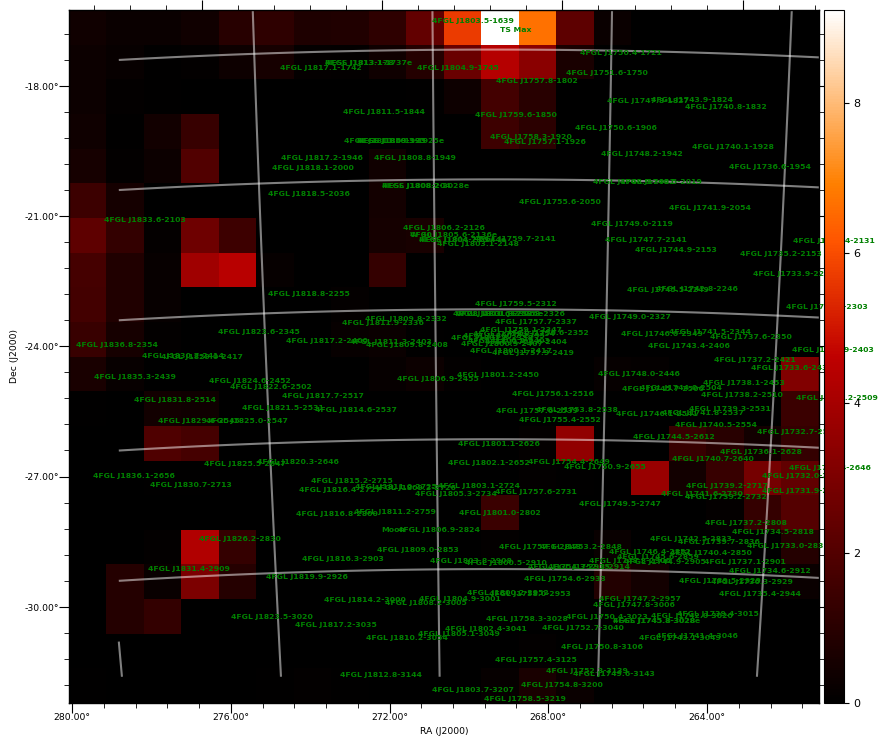
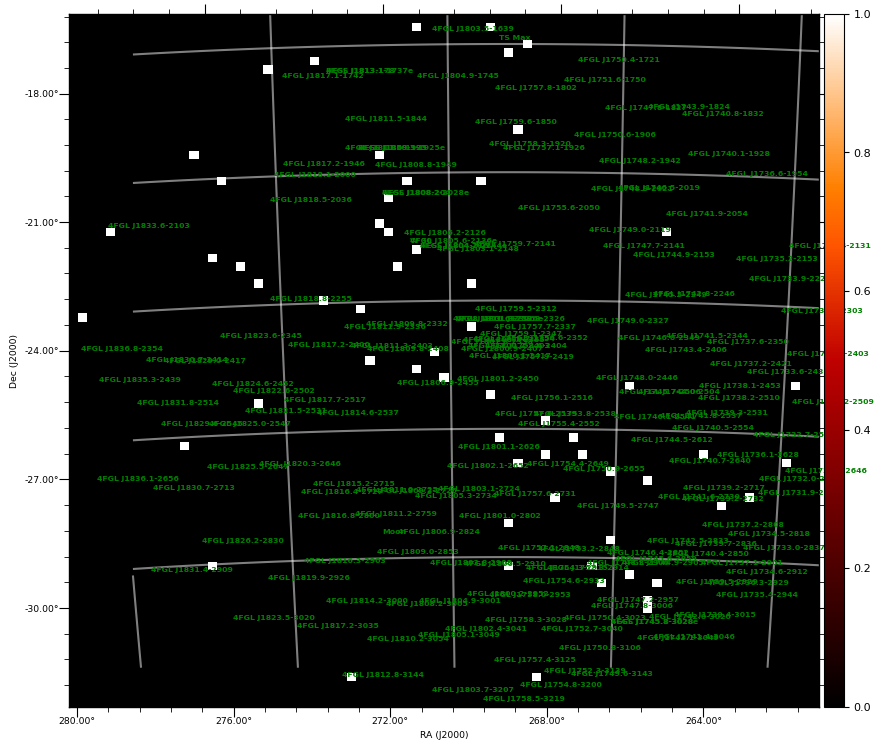
| TS MAXIMUM |
|---|
|
TS = 9.2 |
Ra | 269.38° |
| Dec | -16.87° |
| Nearby 4FGL sources | 1 |
| 4FGL J1758.7-1621 | Δ=0.59° |
| Sun in this pixel? | False |
| Moon in this pixel? | False |
|
|
TS MAP |
COUNT MAP |
|
|
|
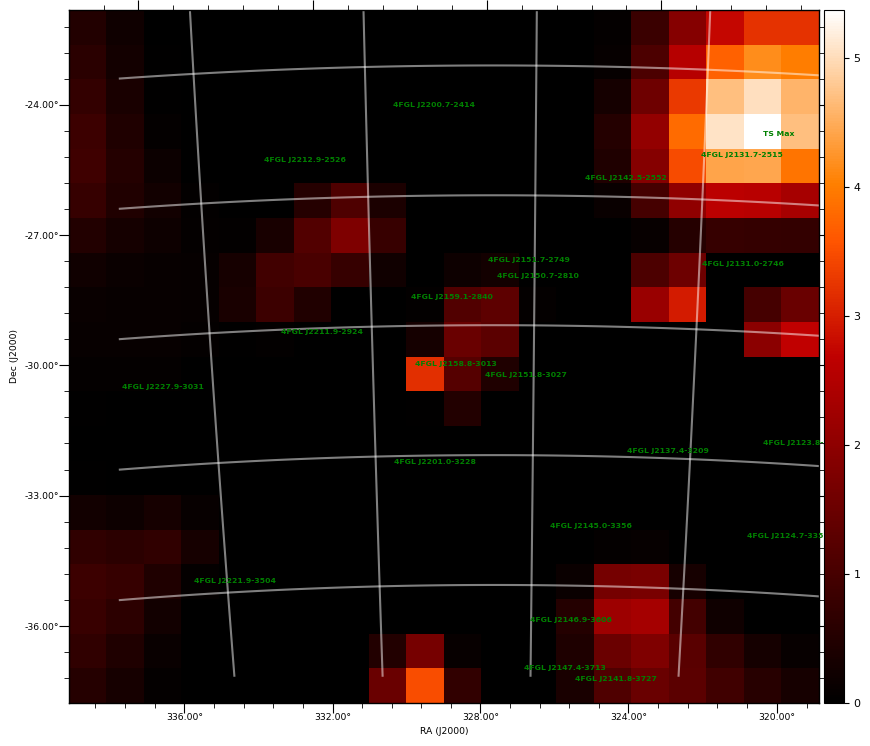
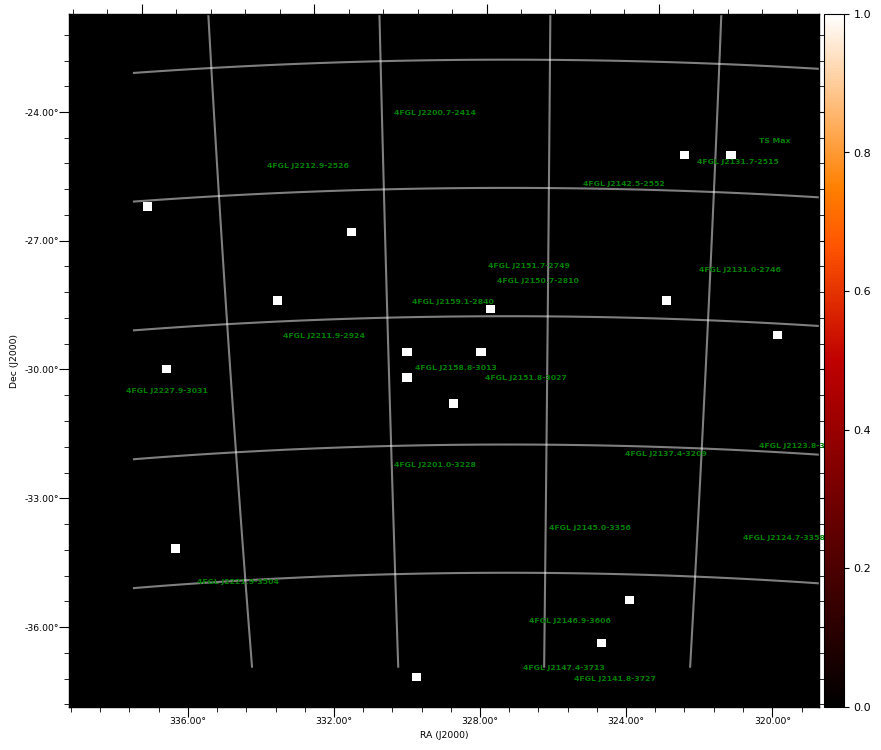
| TS MAXIMUM |
|---|
|
TS = 5.4 |
Ra | 321.51° |
| Dec | -24.69° |
| Nearby 4FGL sources | 1 |
| 4FGL J2124.9-2433 | Δ=0.29° |
| Sun in this pixel? | False |
| Moon in this pixel? | False |
|
|
TS MAP |
COUNT MAP |
|
|
|
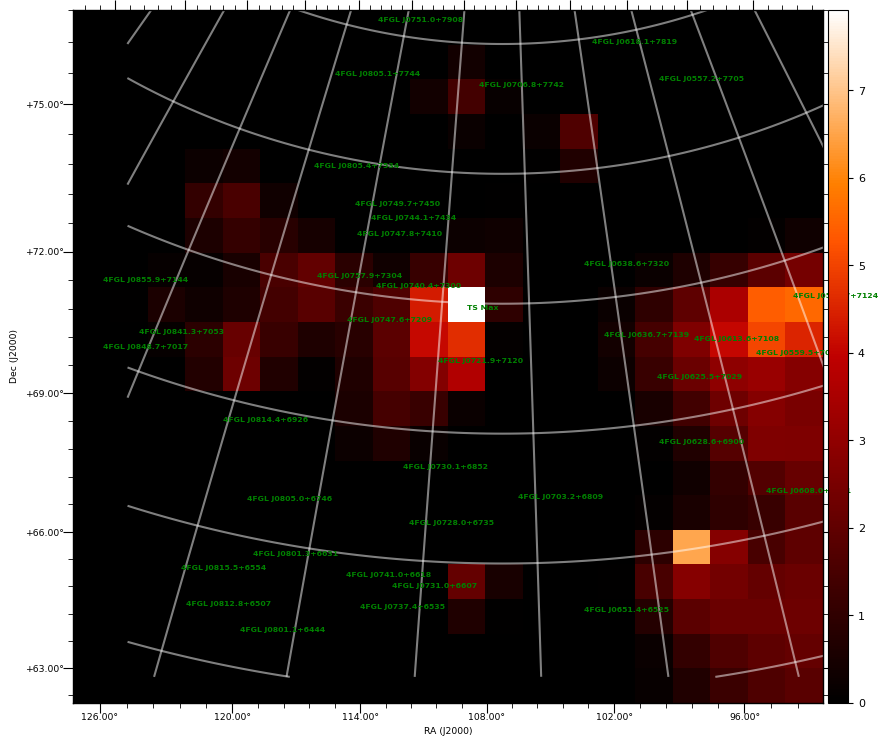
| TS MAXIMUM |
|---|
|
TS = 7.9 |
Ra | 108.5° |
| Dec | 72.58° |
| Nearby 4FGL sources | 0 |
| Sun in this pixel? | False |
| Moon in this pixel? | False |
|
|
TS MAP |
COUNT MAP |
|

|
|
|
|