| GWFUP ANALYSIS REPORT FOR GW S241101ee |
|
|
|
| SUMMARY | |
| Name | S241101ee |
| Trigger MET | 752191528.06 |
| Date | 2024-11-01 |
| Time | 22:05:23 |
| In SAA? | True |
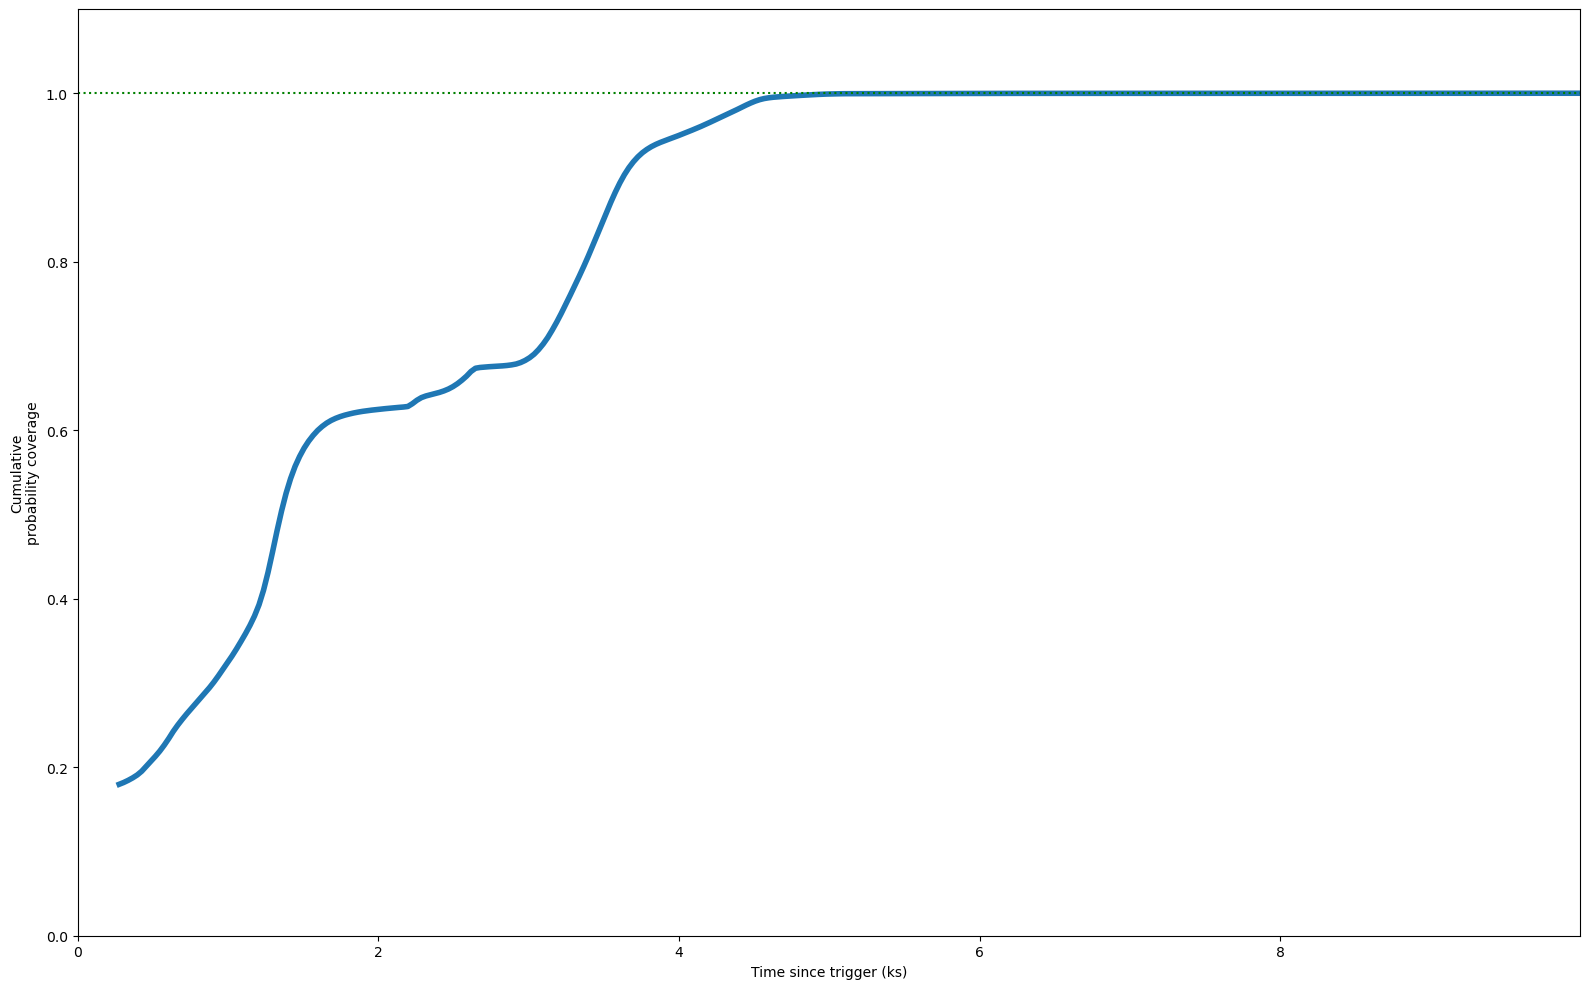
| Inst Coverage | 18.0% (0.3 ks) |
| T Max Coverage | 9.5 ks (100.0%) |
| E Min | 100.0 MeV |
| E Max | 100000.0 MeV |
| T Start | 0.0 s |
| T Stop | 10000.0 s |
| Theta Max | 65.0° |
| Z Max | 100.0° |
| ROI | 8.0° |
| IRF | p8_source |
| Galactic Model | template |
| Strategy | time |
| Particle Model | isotr template |
| NSide | 64 |
| Version | v02 |
|
| COVERAGE |
|
|
| FIXED TIME INTERVAL ANALYSIS |
|
| TS MAXIMUM |
|---|
|
TS = 20.7 |
Ra | 145.55° |
| Dec | 9.59° |
| Nearby 4FGL sources | 0 |
| Sun in this pixel? | False |
| Moon in this pixel? | False |
| LIST OF OTHER TS > 25.0 |
|---|
|
| TS MAP |

|
|
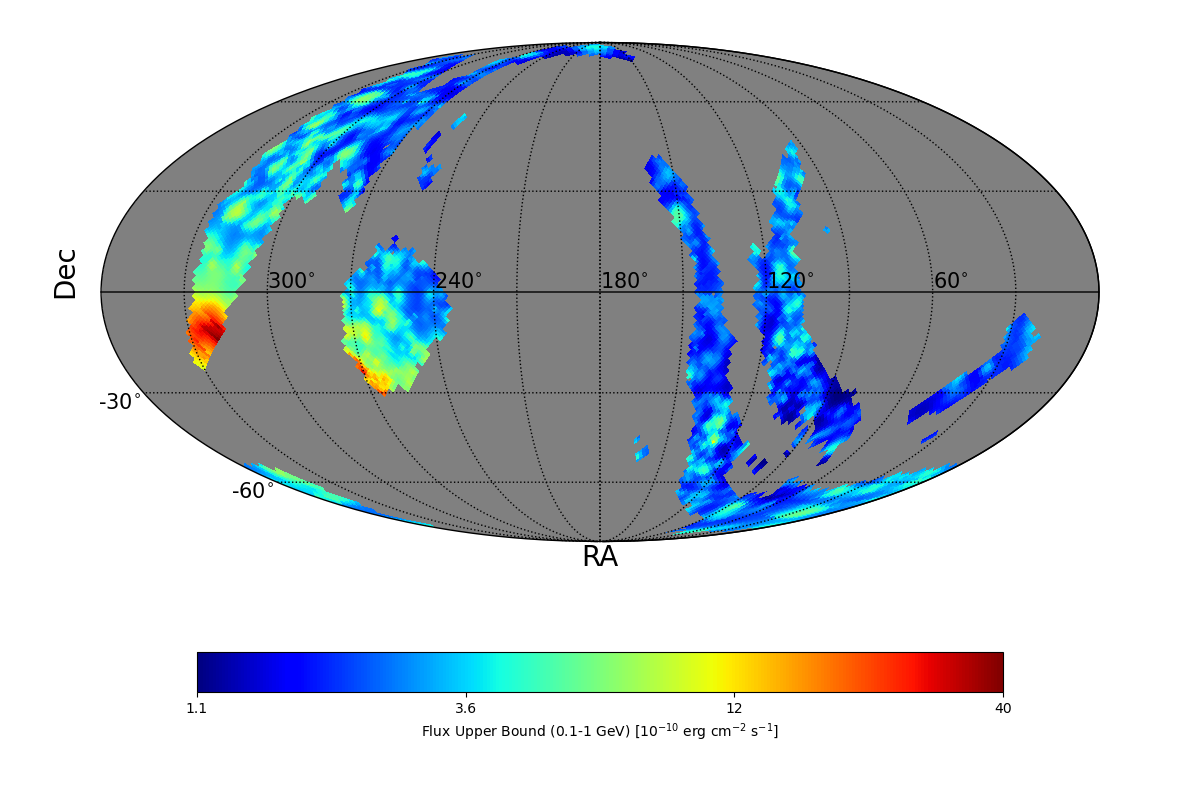
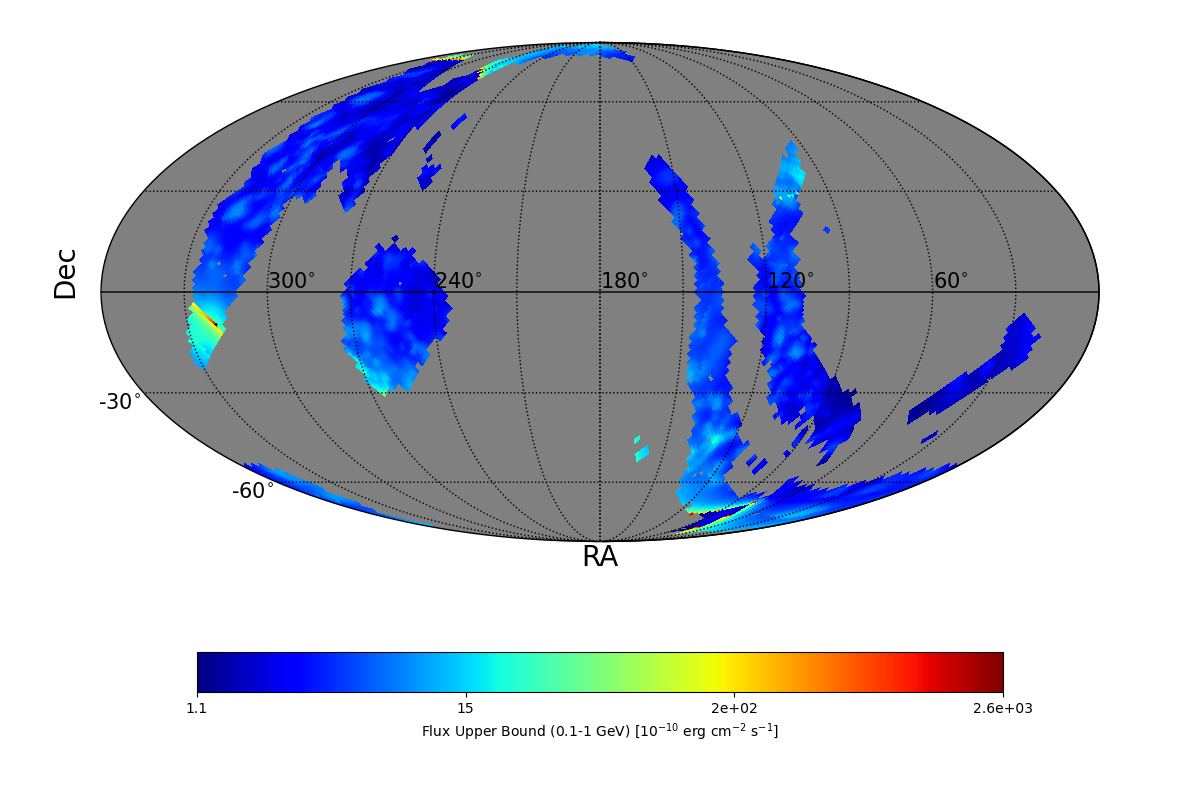
| FLUX UB EXTREMES |
| UB min | 1.08 e-10 erg cm-2 s-1 |
| UB max | 4.0 e-9 erg cm-2 s-1 |
| BAYESIAN FLUX UB (CL=95%) |
| Photon flux | 14.34 e-7 ph cm-2 s-1 |
| Energy flux | 5.75 e-10 erg cm-2 s-1 |
|
| UL MAP |
|
|
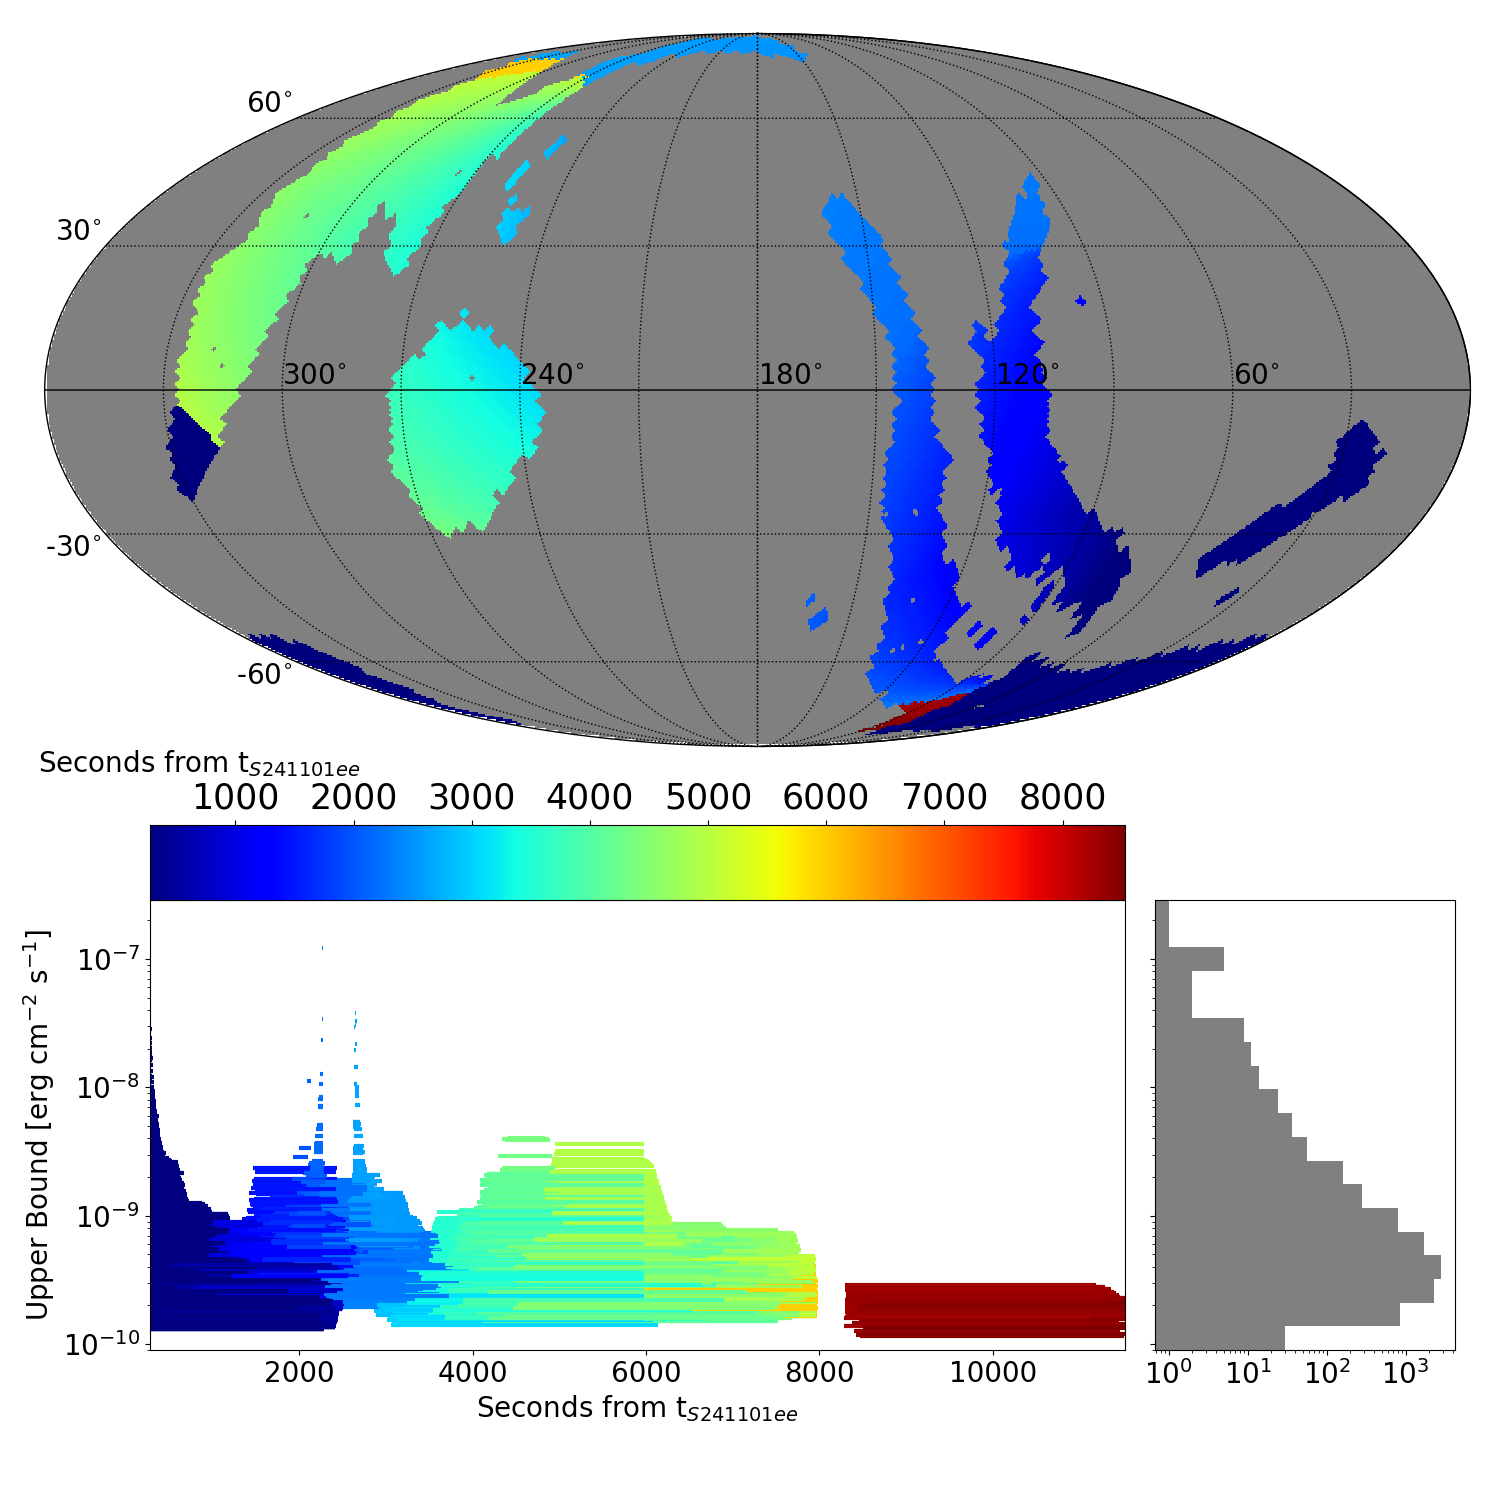
| ADAPTIVE TIME INTERVAL ANALYSIS |
|
|
|
DISTRIBUTION OF THE UPPER BOUNDS |
|
|
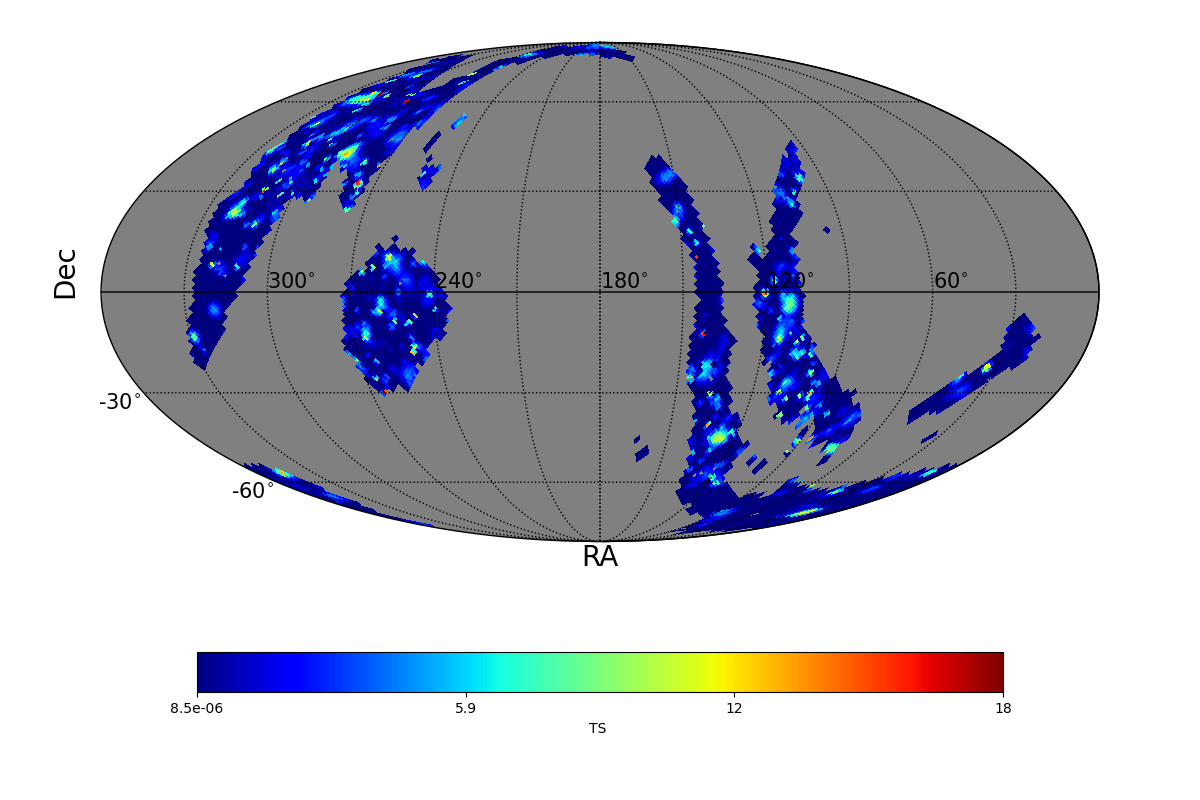
| TS MAXIMUM |
|---|
|
TS = 17.7 |
Ra | 120.23° |
| Dec | 0.0° |
| Nearby 4FGL sources | 1 |
| 4FGL J0759.9+0005 | Δ=0.25° |
| Sun in this pixel? | False |
| Moon in this pixel? | False |
| LIST OF OTHER TS > 25.0 |
|---|
|
|
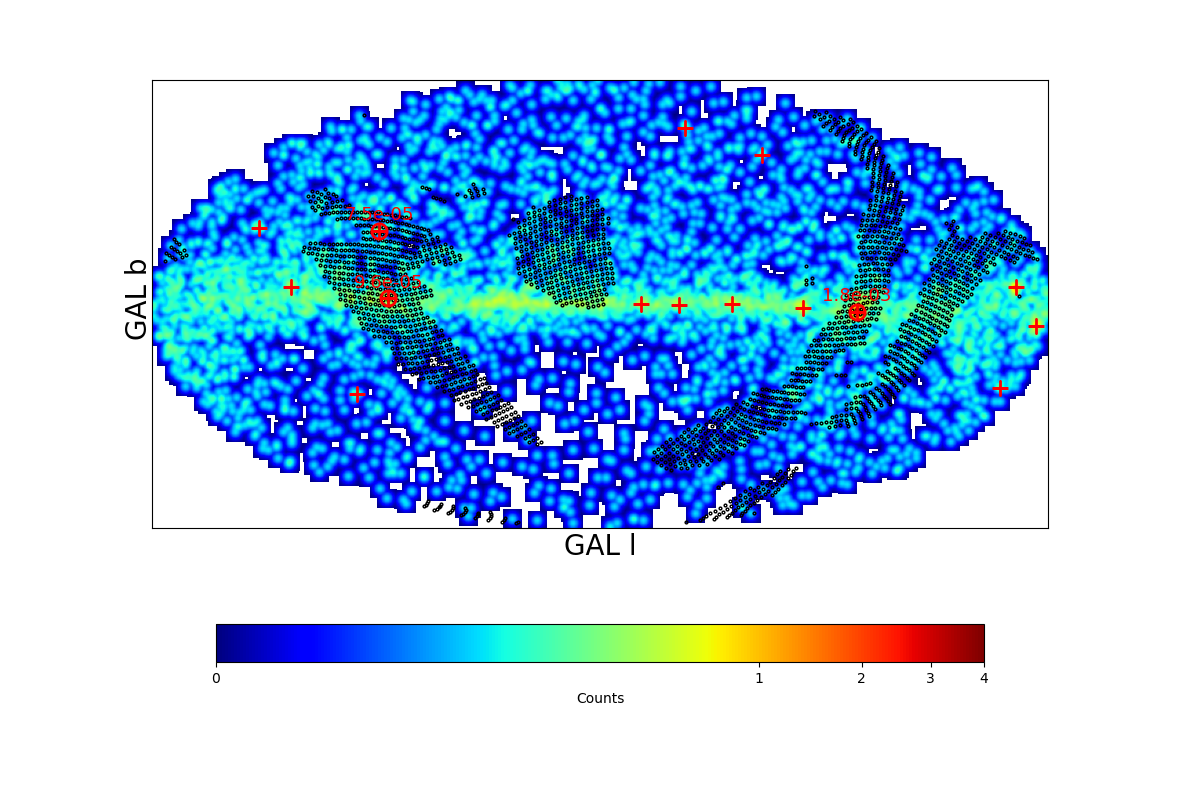
TS MAP |
|
|
| FLUX UB EXTREMES |
| UB min | 1.15 e-10 erg cm-2 s-1 |
| UB max | 262.0 e-9 erg cm-2 s-1 |
|
|
UL MAP |
|
|
|
|
|
|
COUNT MAP |
|
|
| TS MAXIMUM |
|---|
|
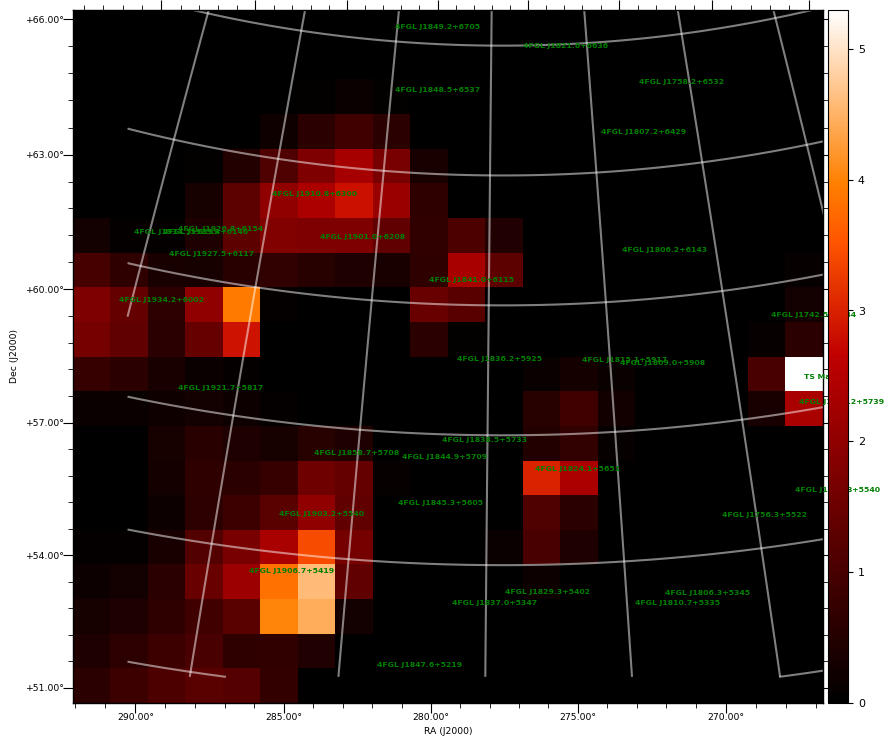
TS = 5.3 |
Ra | 264.88° |
| Dec | 58.19° |
| Nearby 4FGL sources | 1 |
| 4FGL J1741.2+5739 | Δ=0.58° |
| Sun in this pixel? | False |
| Moon in this pixel? | False |
|
|
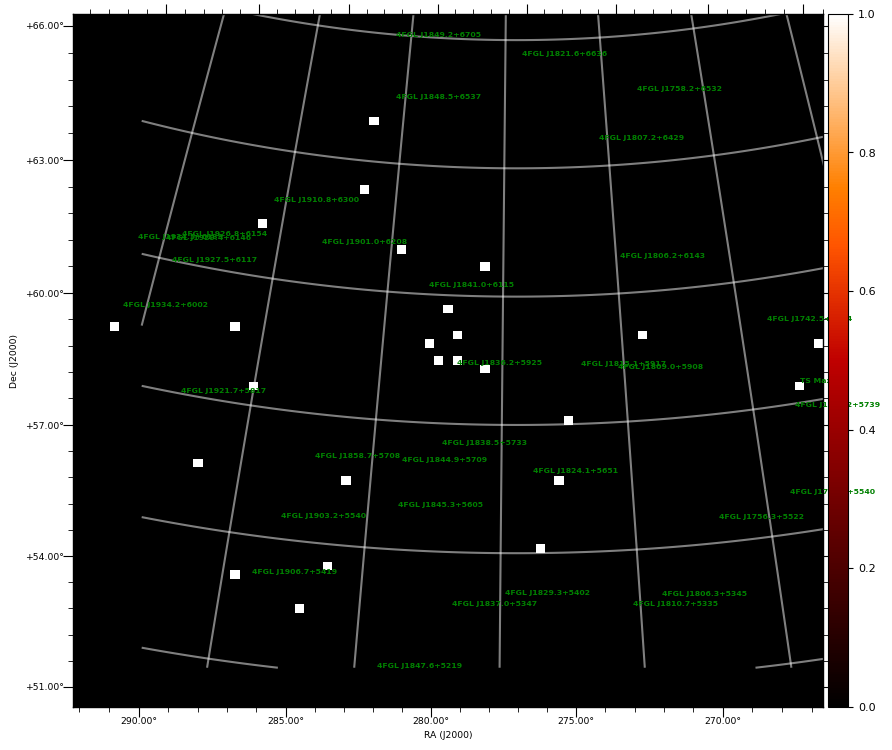
TS MAP |
COUNT MAP |
|
|
|
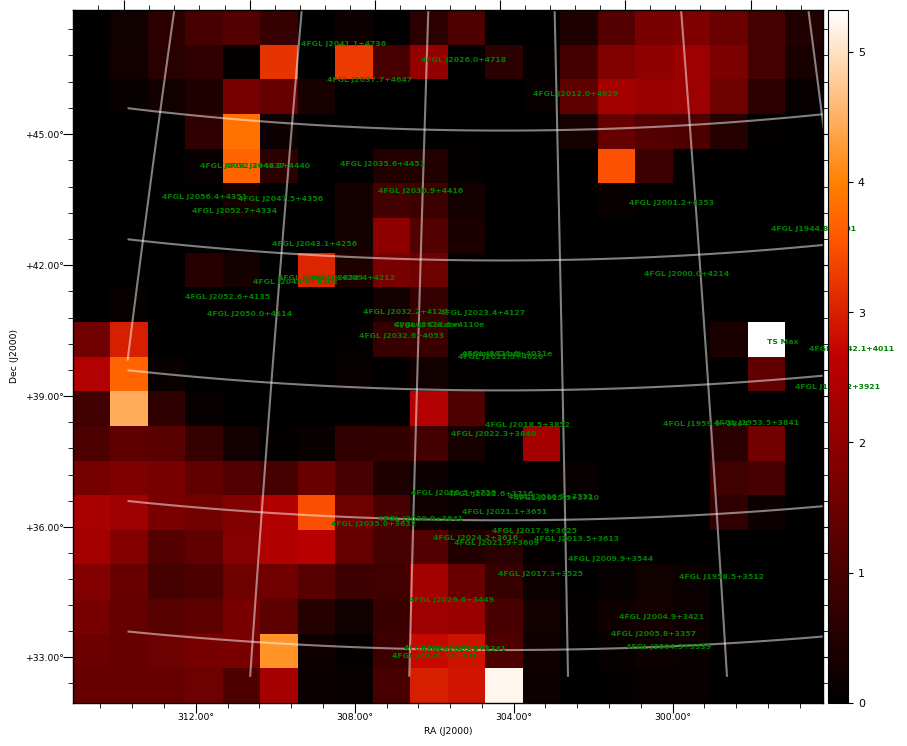
| TS MAXIMUM |
|---|
|
TS = 5.3 |
Ra | 296.7° |
| Dec | 40.44° |
| Nearby 4FGL sources | 1 |
| 4FGL J1942.1+4011 | Δ=0.92° |
| Sun in this pixel? | False |
| Moon in this pixel? | False |
|
|
TS MAP |
COUNT MAP |
|

|
|
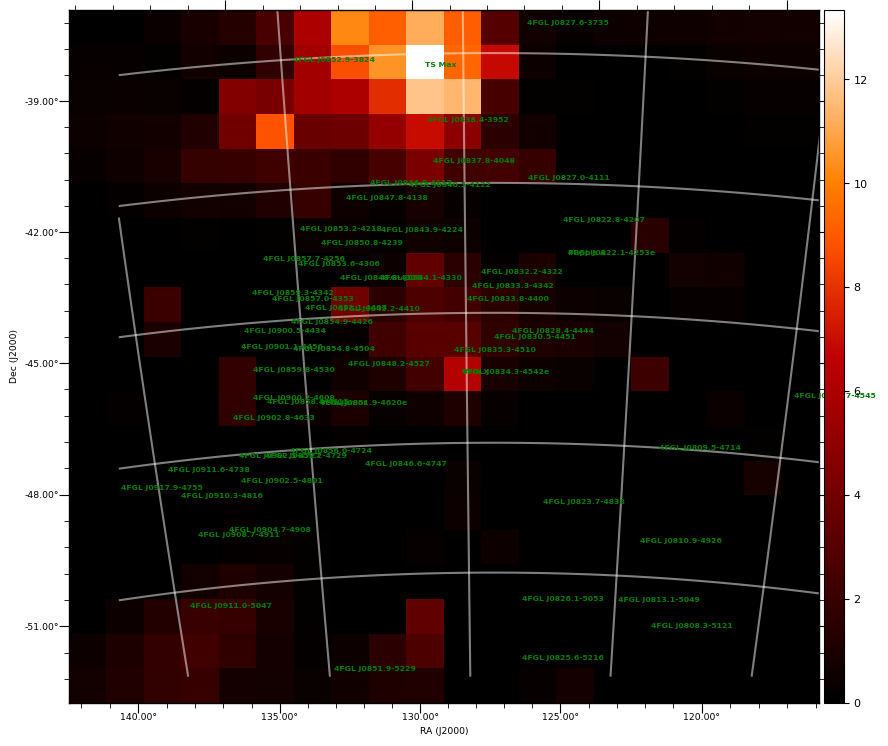
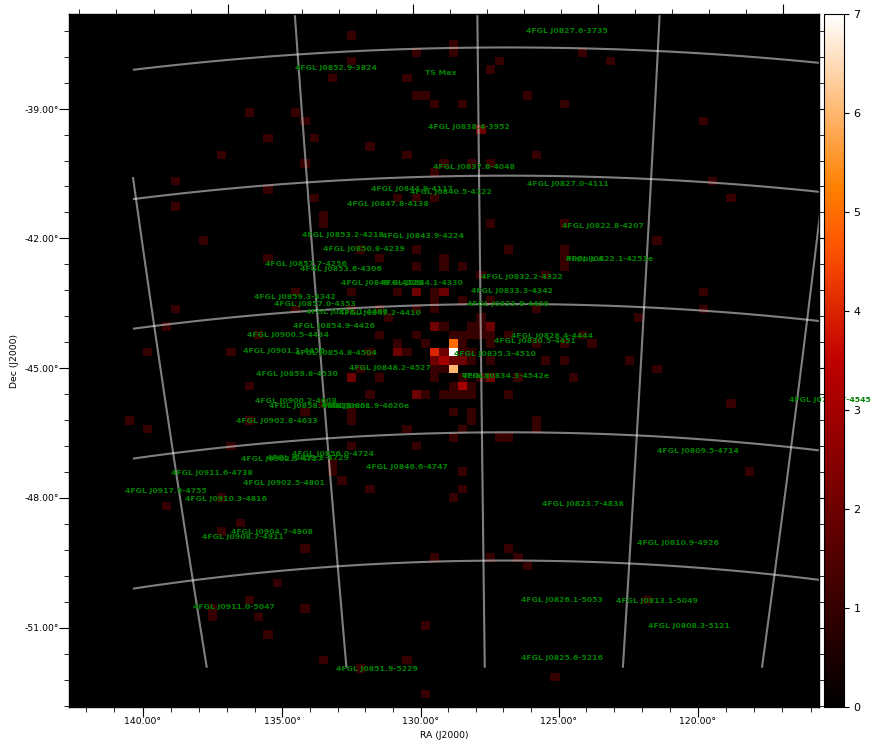
| TS MAXIMUM |
|---|
|
TS = 13.3 |
Ra | 129.67° |
| Dec | -38.6° |
| Nearby 4FGL sources | 0 |
| Sun in this pixel? | False |
| Moon in this pixel? | False |
|
|
TS MAP |
COUNT MAP |
|
|
|
|
|