| GWFUP ANALYSIS REPORT FOR GW S240915bd |
|
|
|
| SUMMARY | |
| Name | S240915bd |
| Trigger MET | 748090316.07 |
| Date | 2024-09-15 |
| Time | 10:51:51 |
| In SAA? | False |
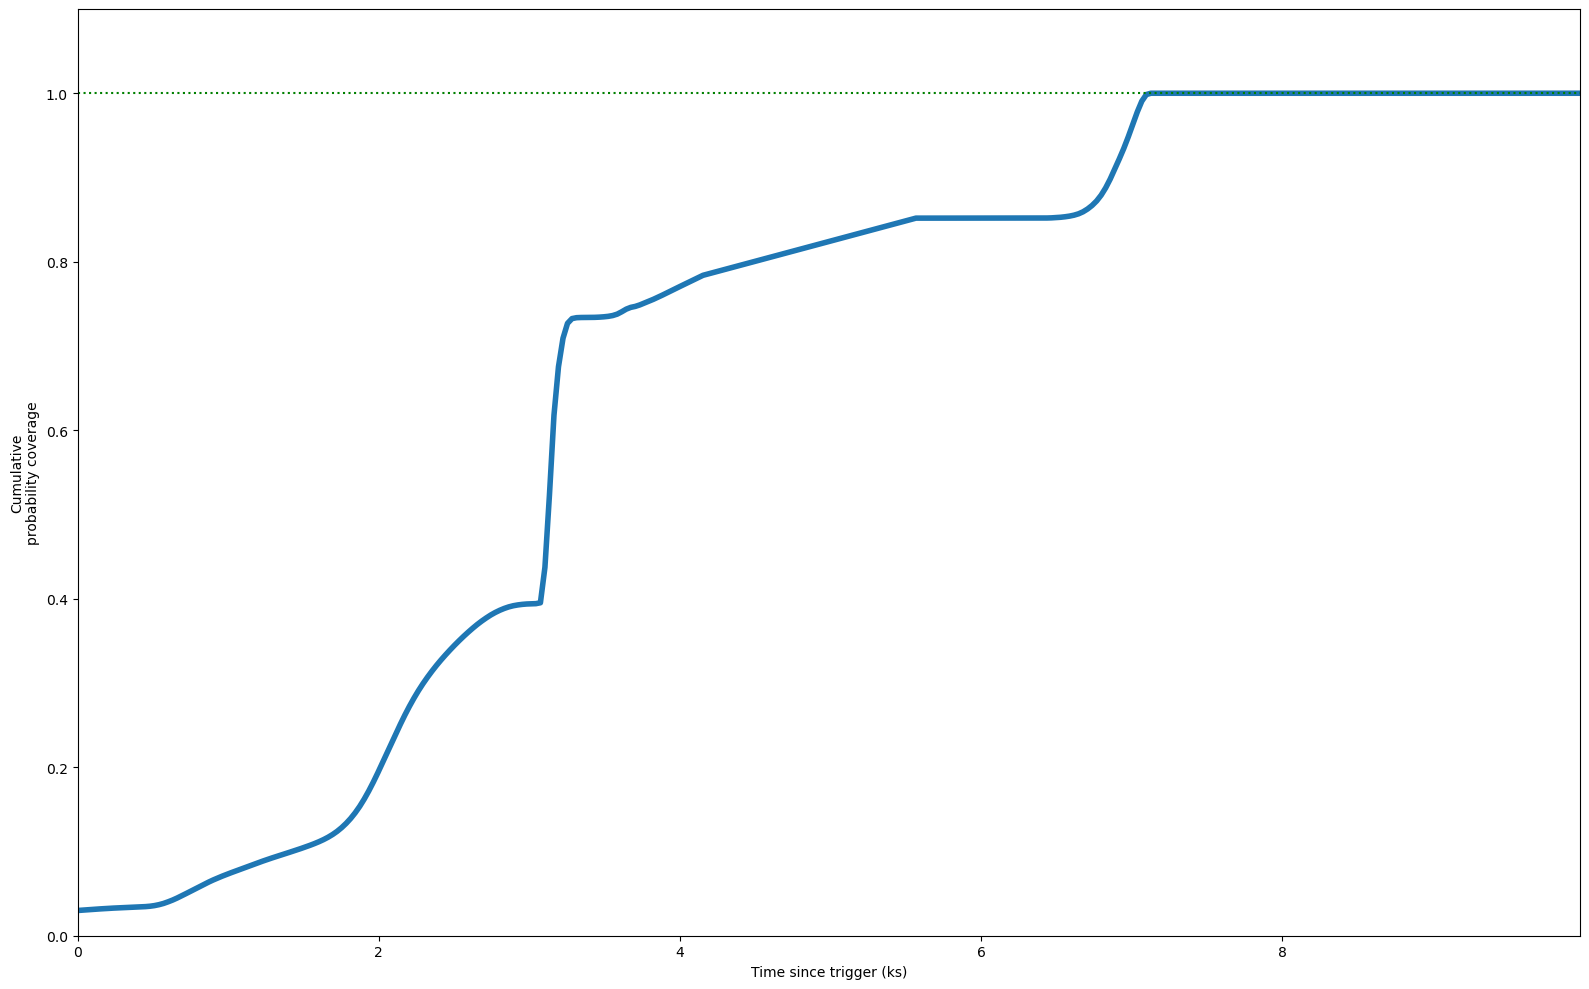
| Inst Coverage | 3.0% |
| T Max Coverage | 9.9 ks (100.0%) |
| E Min | 100.0 MeV |
| E Max | 100000.0 MeV |
| T Start | 0.0 s |
| T Stop | 10000.0 s |
| Theta Max | 65.0° |
| Z Max | 100.0° |
| ROI | 8.0° |
| IRF | p8_source |
| Galactic Model | template |
| Strategy | time |
| Particle Model | isotr template |
| NSide | 64 |
| Version | v02 |
|
| COVERAGE |
|
|
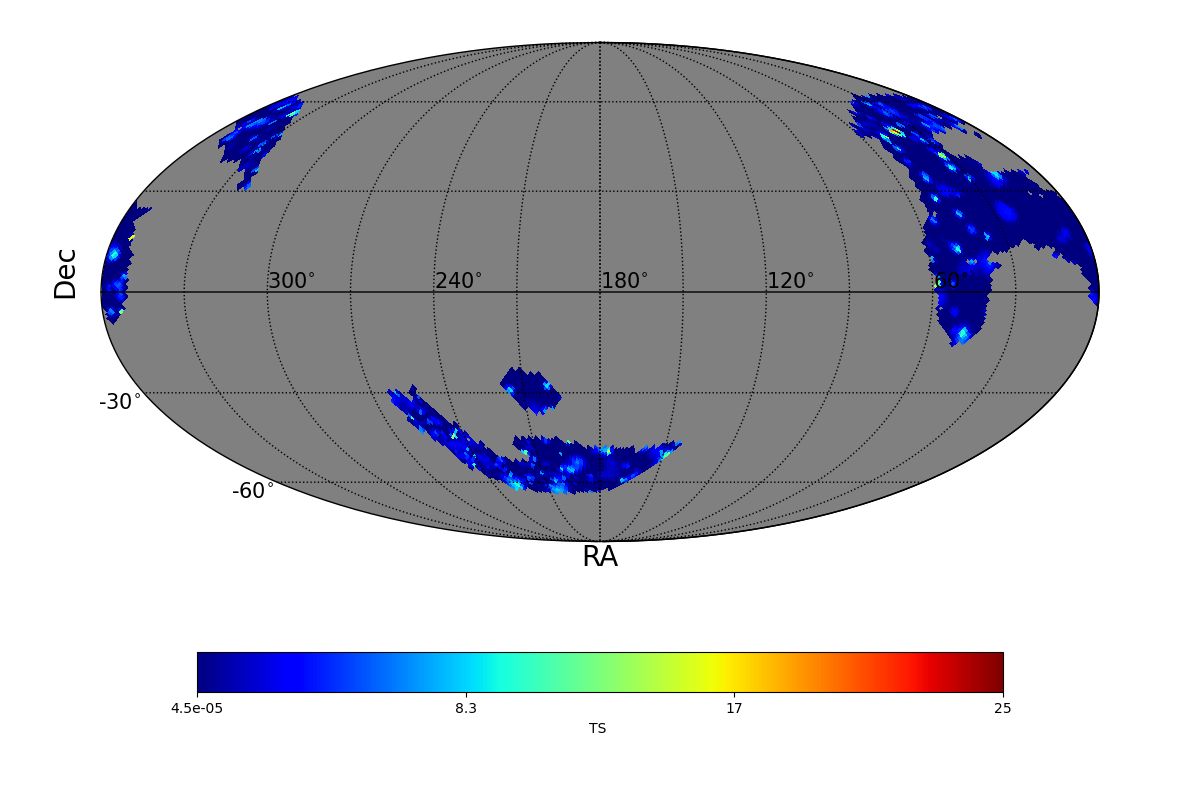
| FIXED TIME INTERVAL ANALYSIS |
|
| TS MAXIMUM |
|---|
|
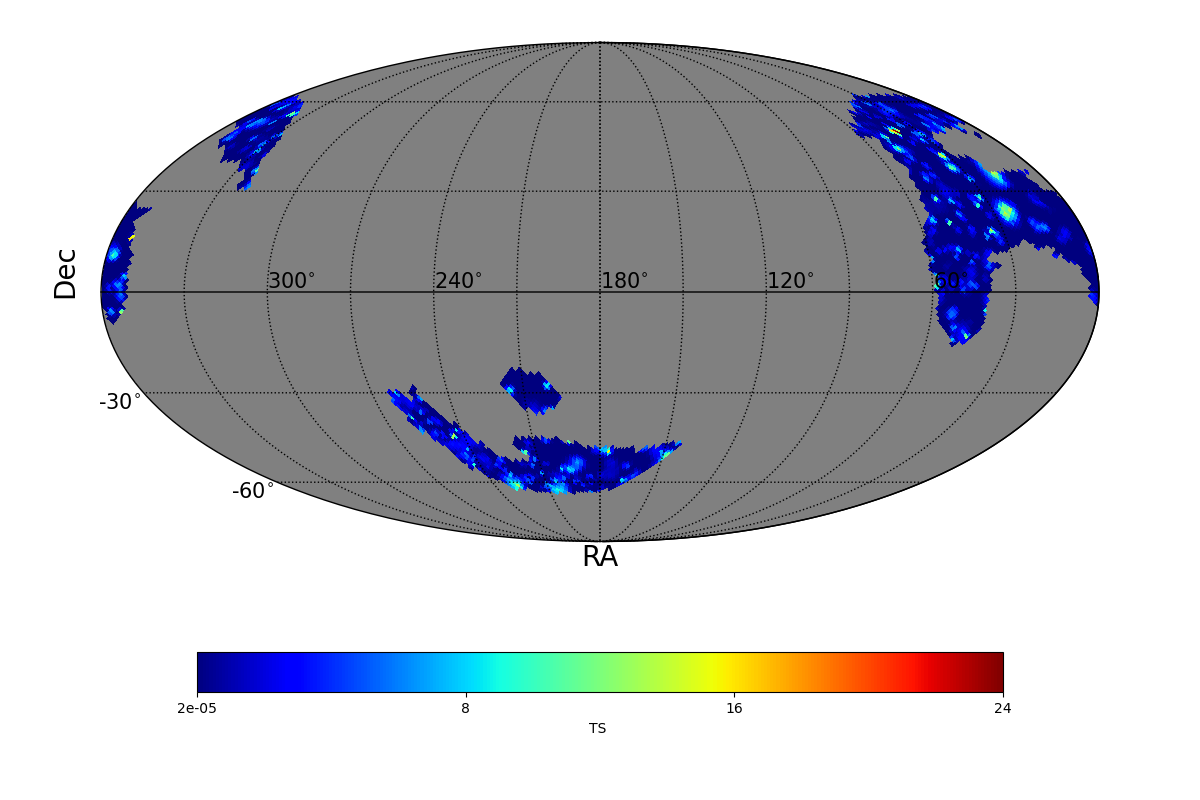
TS = 24.0 |
Ra | 40.09° |
| Dec | 48.92° |
| Nearby 4FGL sources | 0 |
| Sun in this pixel? | False |
| Moon in this pixel? | False |
| LIST OF OTHER TS > 25.0 |
|---|
|
| TS MAP |
|
|
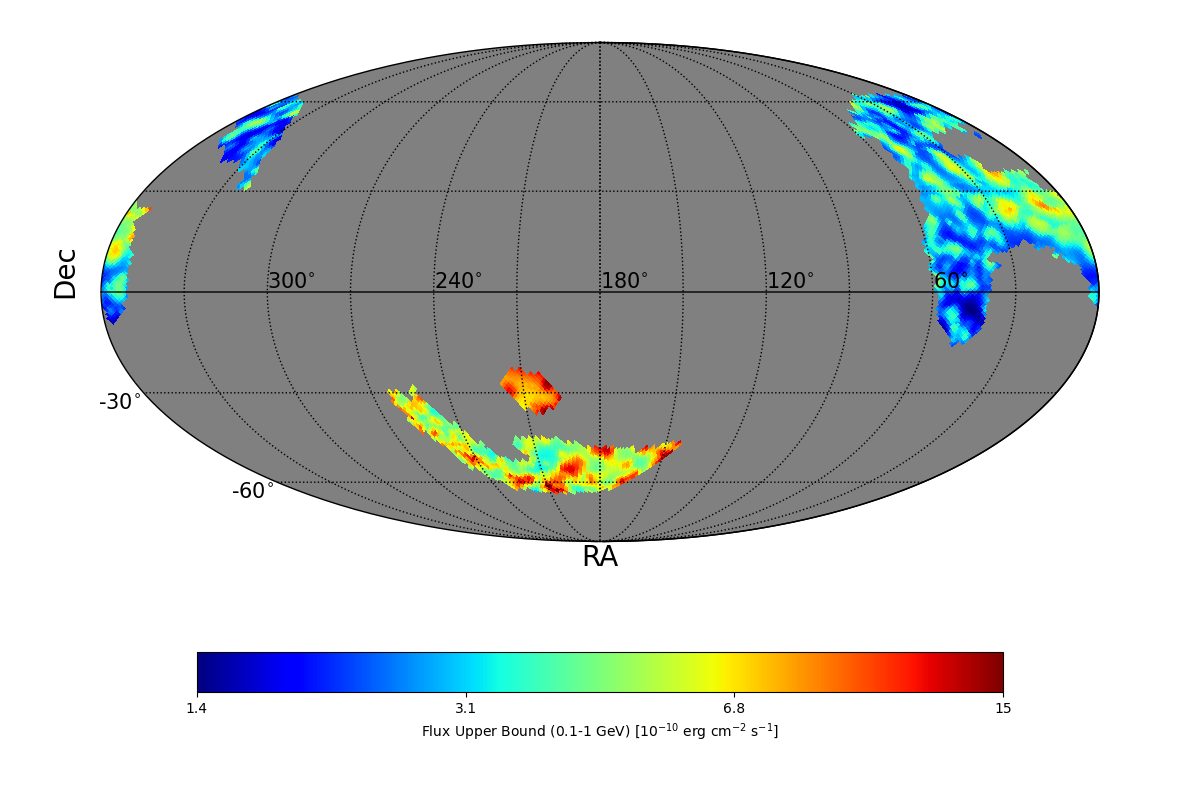
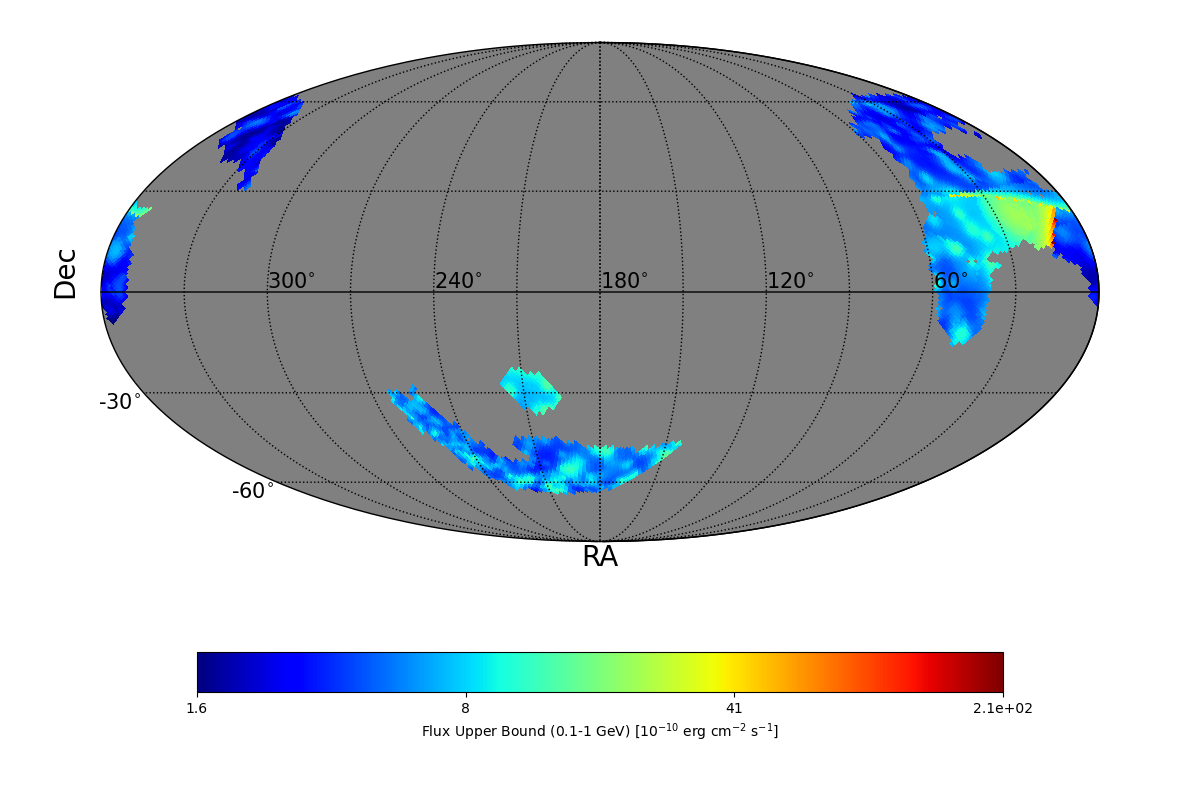
| FLUX UB EXTREMES |
| UB min | 1.4 e-10 erg cm-2 s-1 |
| UB max | 1.5 e-9 erg cm-2 s-1 |
| BAYESIAN FLUX UB (CL=95%) |
| Photon flux | 14.14 e-7 ph cm-2 s-1 |
| Energy flux | 8.43 e-10 erg cm-2 s-1 |
|
| UL MAP |
|
|
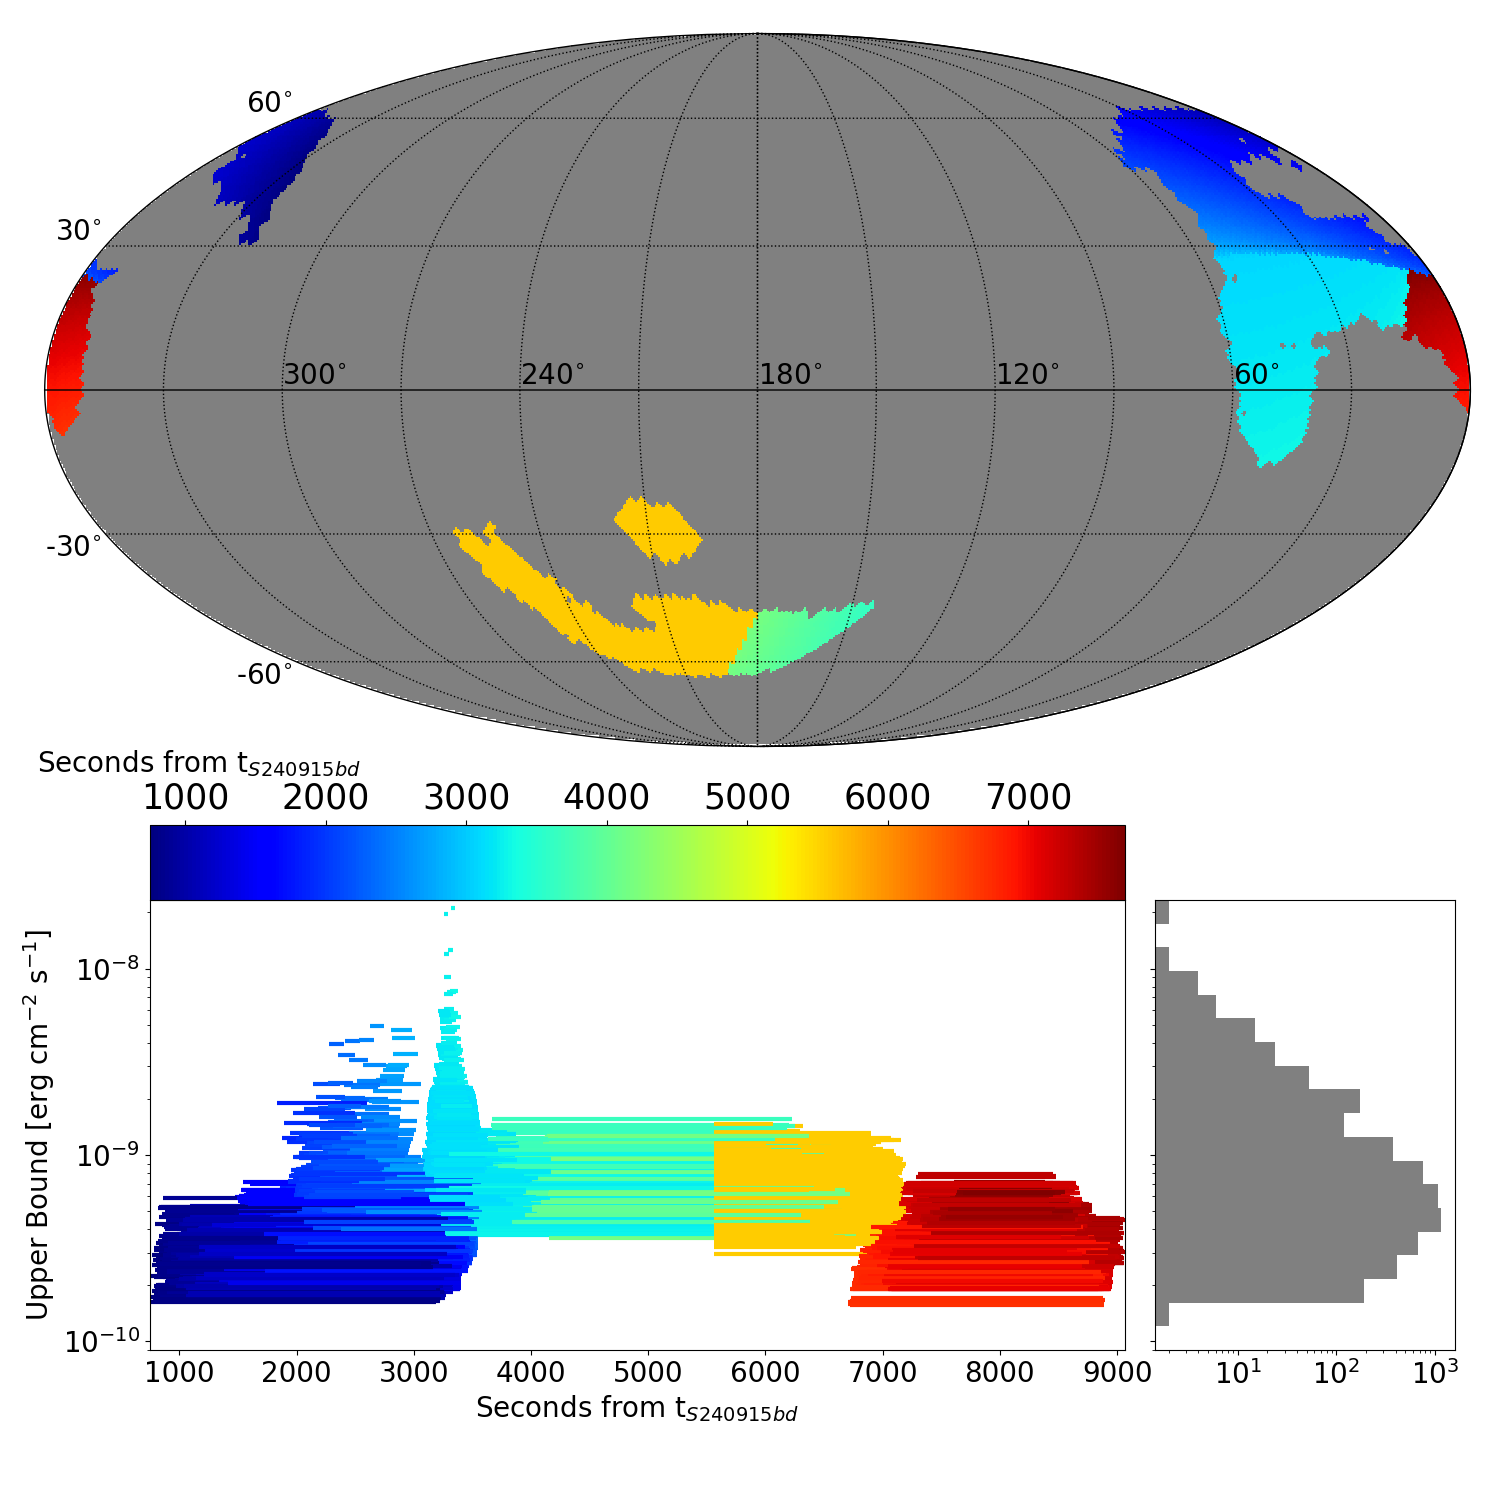
| ADAPTIVE TIME INTERVAL ANALYSIS |
|
|
|
DISTRIBUTION OF THE UPPER BOUNDS |
|
|
| TS MAXIMUM |
|---|
|
TS = 25.0 |
Ra | 40.09° |
| Dec | 48.92° |
| Nearby 4FGL sources | 0 |
| Sun in this pixel? | False |
| Moon in this pixel? | False |
| LIST OF OTHER TS > 25.0 |
|---|
|
|
TS MAP |
|
|
| FLUX UB EXTREMES |
| UB min | 1.56 e-10 erg cm-2 s-1 |
| UB max | 21.2 e-9 erg cm-2 s-1 |
|
|
UL MAP |
|
|
|
|
|
|
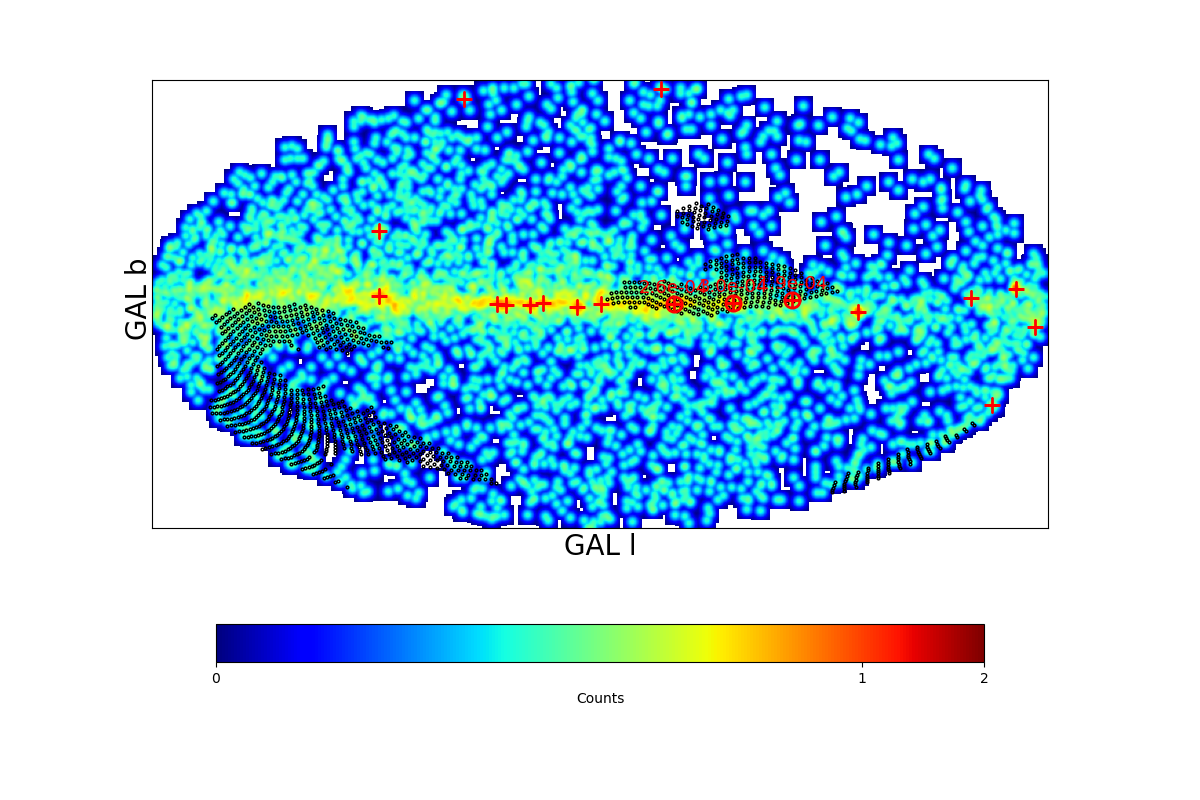
COUNT MAP |
|
|
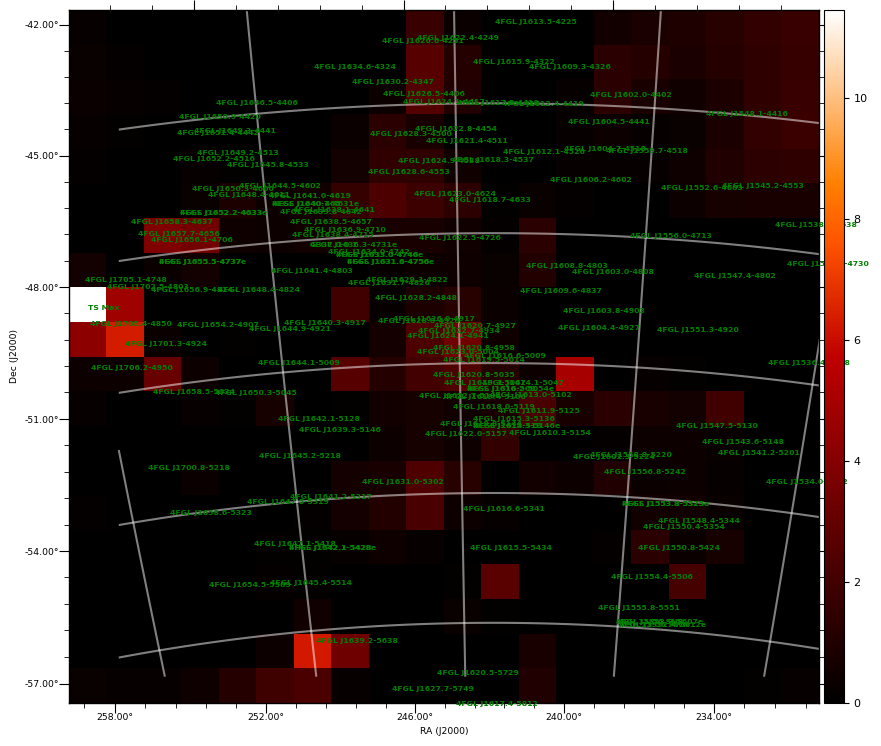
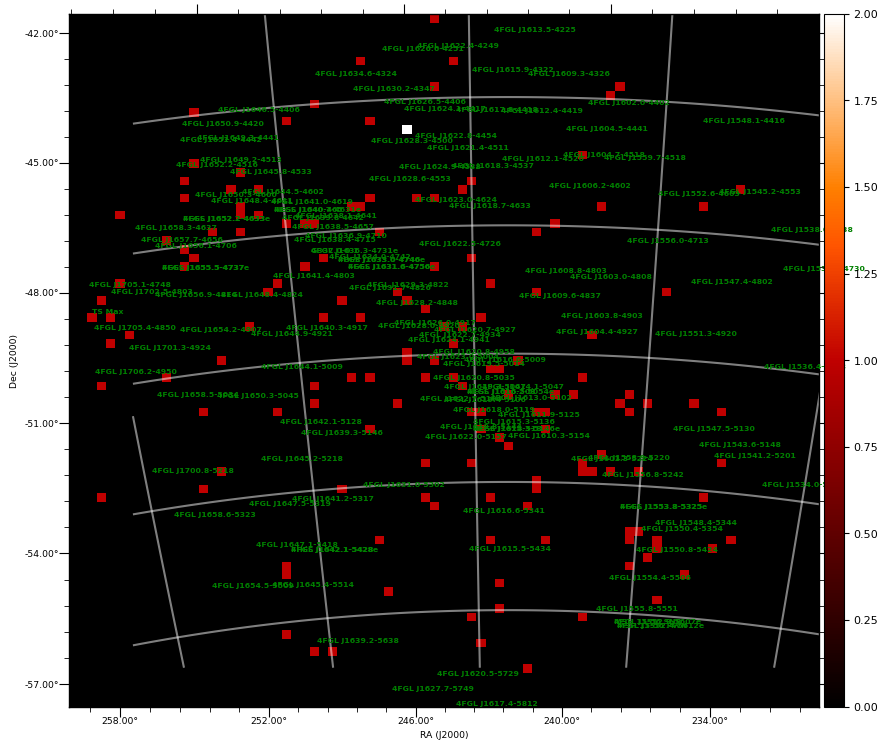
| TS MAXIMUM |
|---|
|
TS = 11.5 |
Ra | 256.35° |
| Dec | -48.46° |
| Nearby 4FGL sources | 3 |
| 4FGL J1702.5-4803 | Δ=0.62° |
| 4FGL J1705.1-4748 | Δ=0.65° |
| 4FGL J1705.4-4850 | Δ=0.37° |
| Sun in this pixel? | False |
| Moon in this pixel? | False |
|
|
TS MAP |
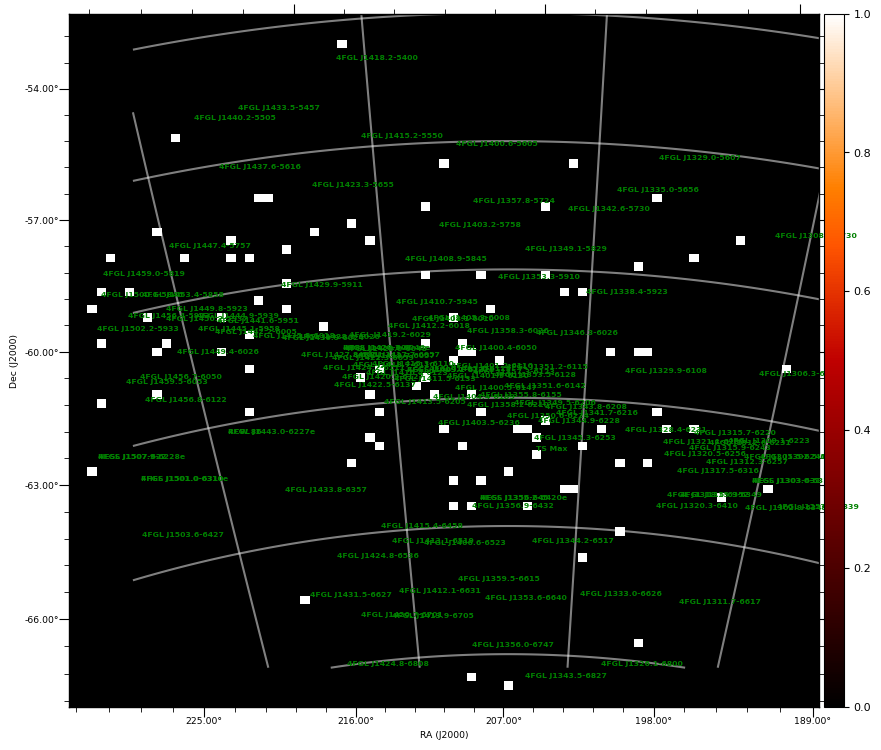
COUNT MAP |
|
|
|
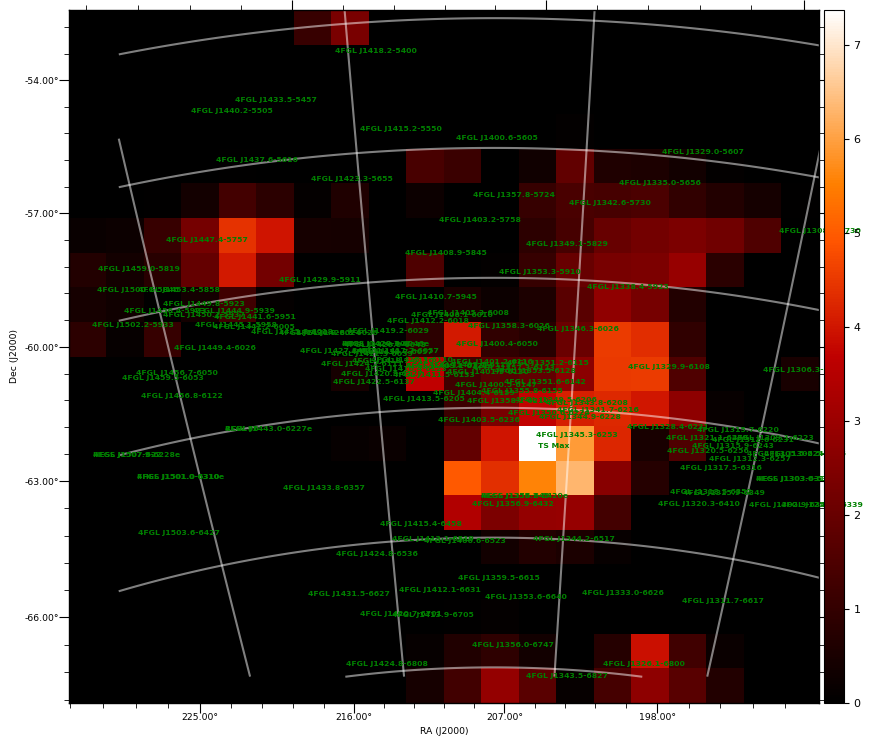
| TS MAXIMUM |
|---|
|
TS = 7.4 |
Ra | 206.2° |
| Dec | -63.14° |
| Nearby 4FGL sources | 4 |
| 4FGL J1341.7-6216 | Δ=0.93° |
| 4FGL J1344.9-6228 | Δ=0.66° |
| 4FGL J1345.3-6253 | Δ=0.26° |
| 4FGL J1350.6-6224 | Δ=0.99° |
| Sun in this pixel? | False |
| Moon in this pixel? | False |
|
|
TS MAP |
COUNT MAP |
|
|
|
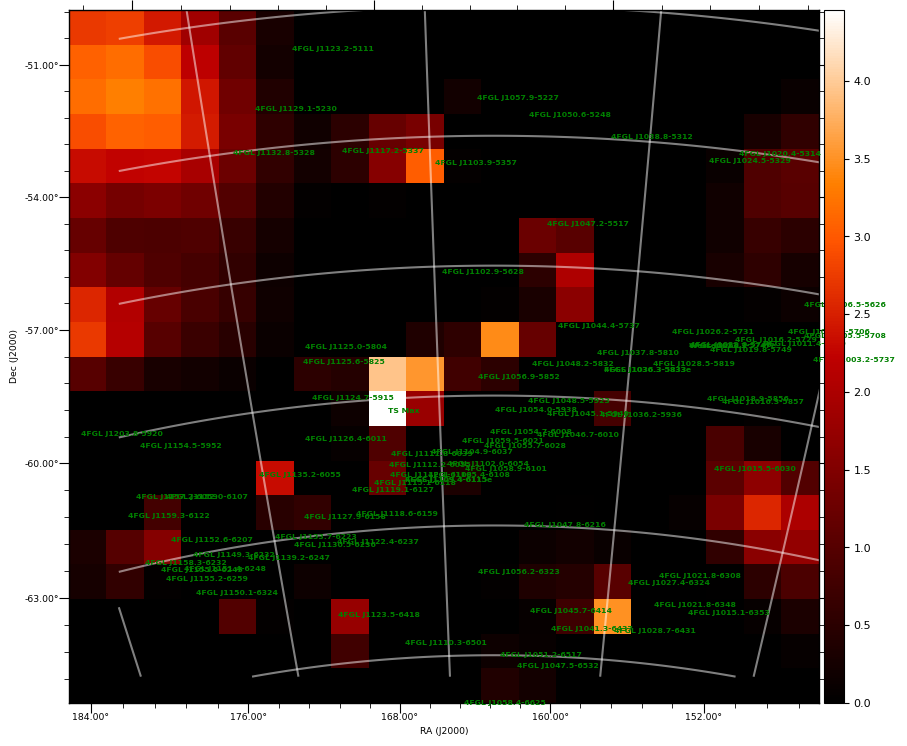
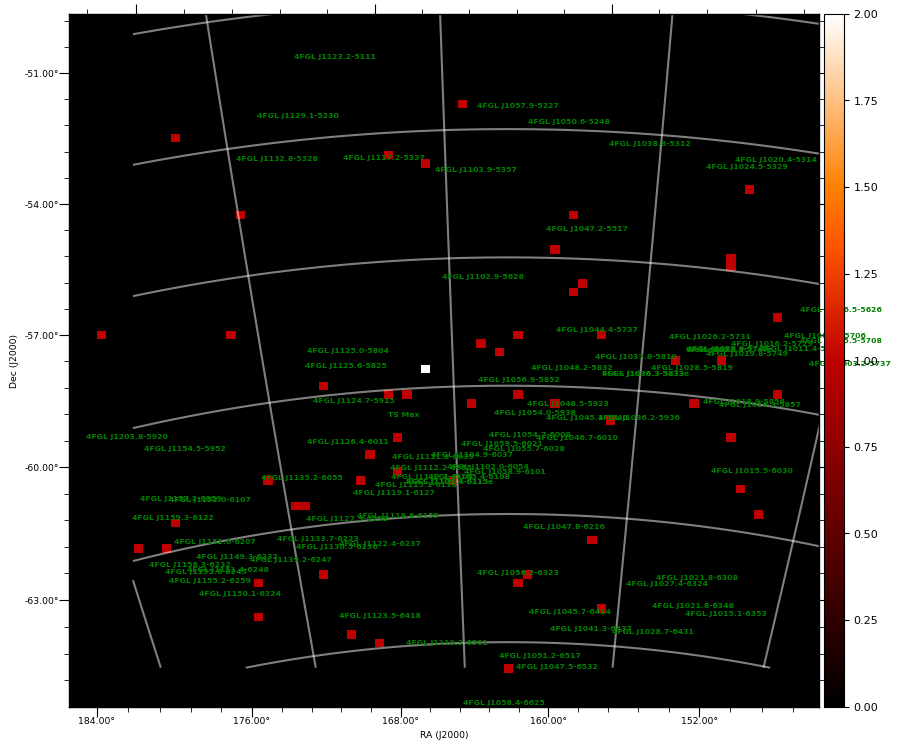
| TS MAXIMUM |
|---|
|
TS = 4.5 |
Ra | 168.04° |
| Dec | -59.67° |
| Nearby 4FGL sources | 1 |
| 4FGL J1111.8-6039 | Δ=0.99° |
| Sun in this pixel? | False |
| Moon in this pixel? | False |
|
|
TS MAP |
COUNT MAP |
|
|
|
|
|