| GWFUP ANALYSIS REPORT FOR GW S240426s |
|
|
|
| SUMMARY | |
| Name | S240426s |
| Trigger MET | 735794096.96 |
| Date | 2024-04-26 |
| Time | 03:14:51 |
| In SAA? | False |
| Inst Coverage | 14.8% |
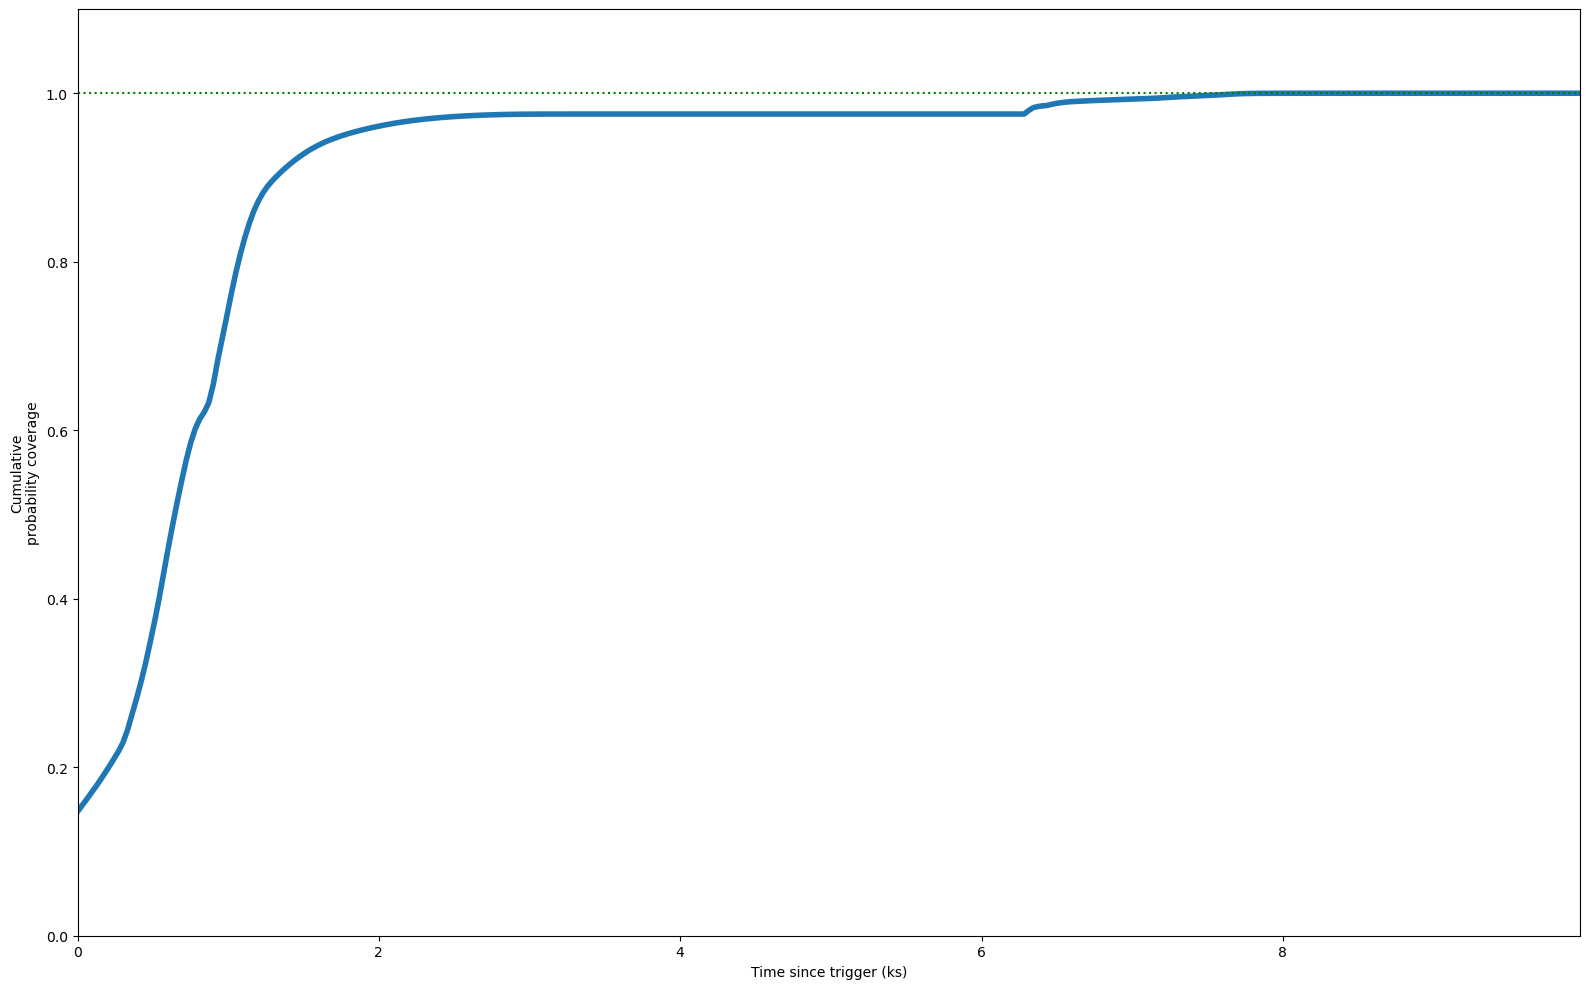
| T Max Coverage | 8.4 ks (100.0%) |
| E Min | 100.0 MeV |
| E Max | 100000.0 MeV |
| T Start | 0.0 s |
| T Stop | 10000.0 s |
| Theta Max | 65.0° |
| Z Max | 100.0° |
| ROI | 8.0° |
| IRF | p8_source |
| Galactic Model | template |
| Strategy | time |
| Particle Model | isotr template |
| NSide | 64 |
| Version | v02 |
|
| COVERAGE |
|
|
| FIXED TIME INTERVAL ANALYSIS |
|
| TS MAXIMUM |
|---|
|
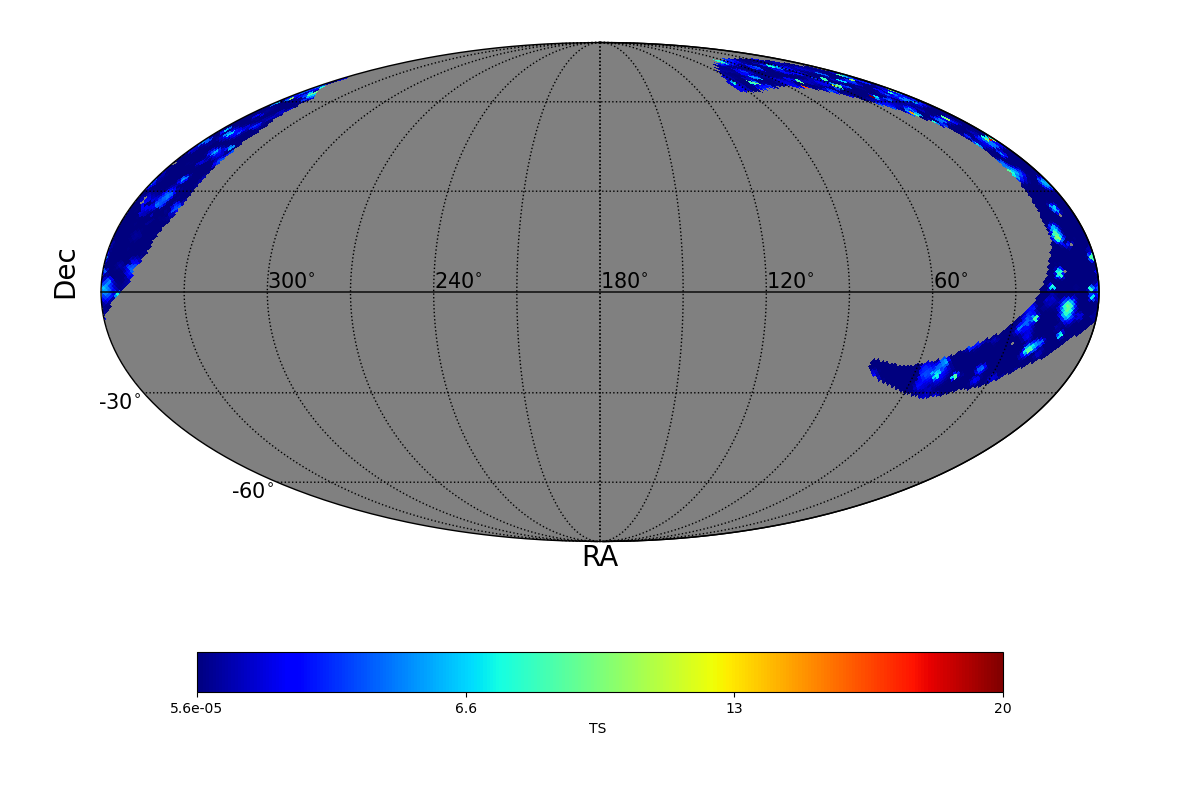
TS = 19.9 |
Ra | 22.5° |
| Dec | 61.94° |
| Nearby 4FGL sources | 1 |
| 4FGL J0131.1+6120 | Δ=0.62° |
| Sun in this pixel? | False |
| Moon in this pixel? | False |
| LIST OF OTHER TS > 25.0 |
|---|
|
| TS MAP |
|
|
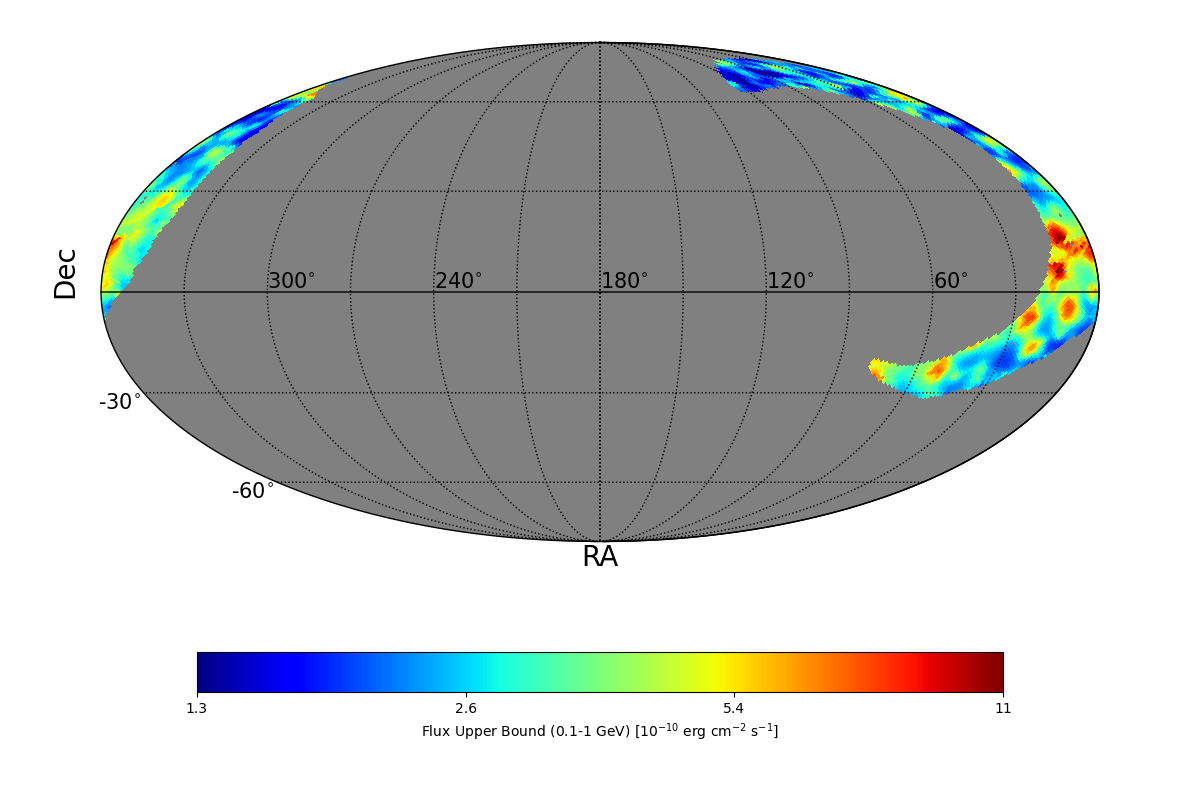
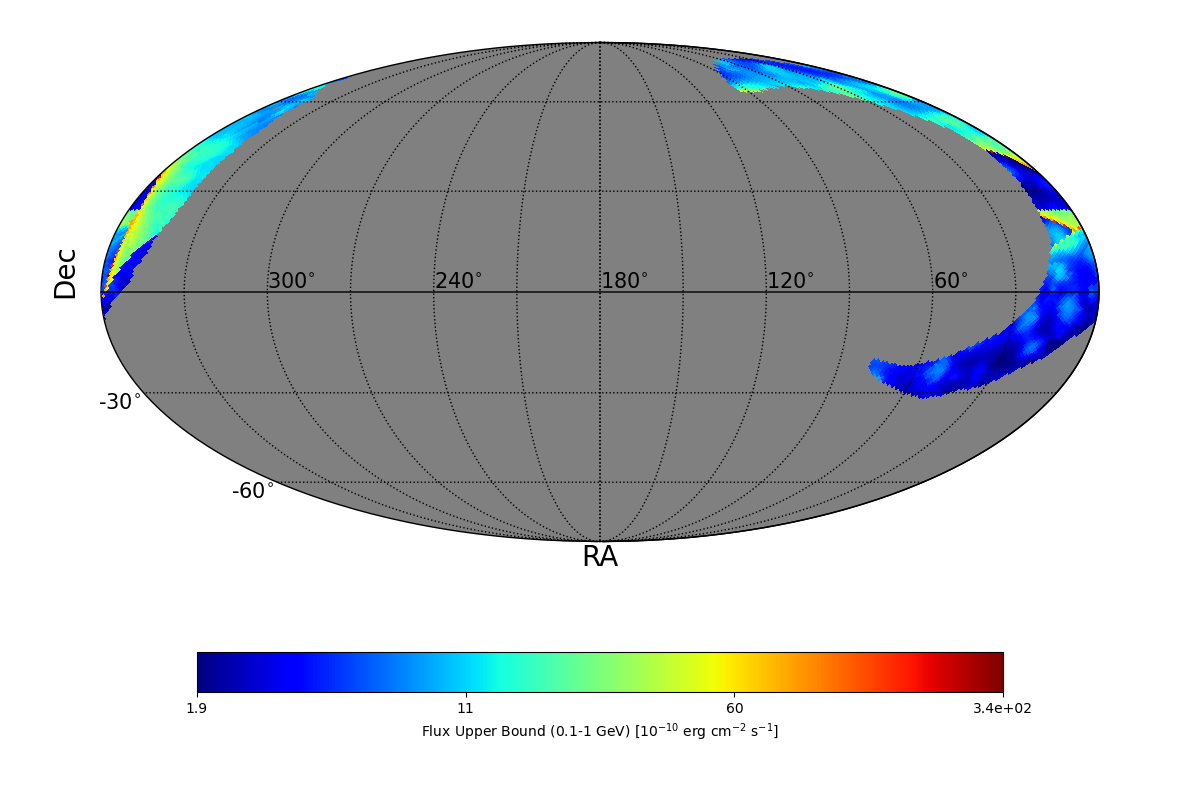
| FLUX UB EXTREMES |
| UB min | 1.29 e-10 erg cm-2 s-1 |
| UB max | 1.1 e-9 erg cm-2 s-1 |
| BAYESIAN FLUX UB (CL=95%) |
| Photon flux | 15.29 e-7 ph cm-2 s-1 |
| Energy flux | 6.51 e-10 erg cm-2 s-1 |
|
| UL MAP |
|
|
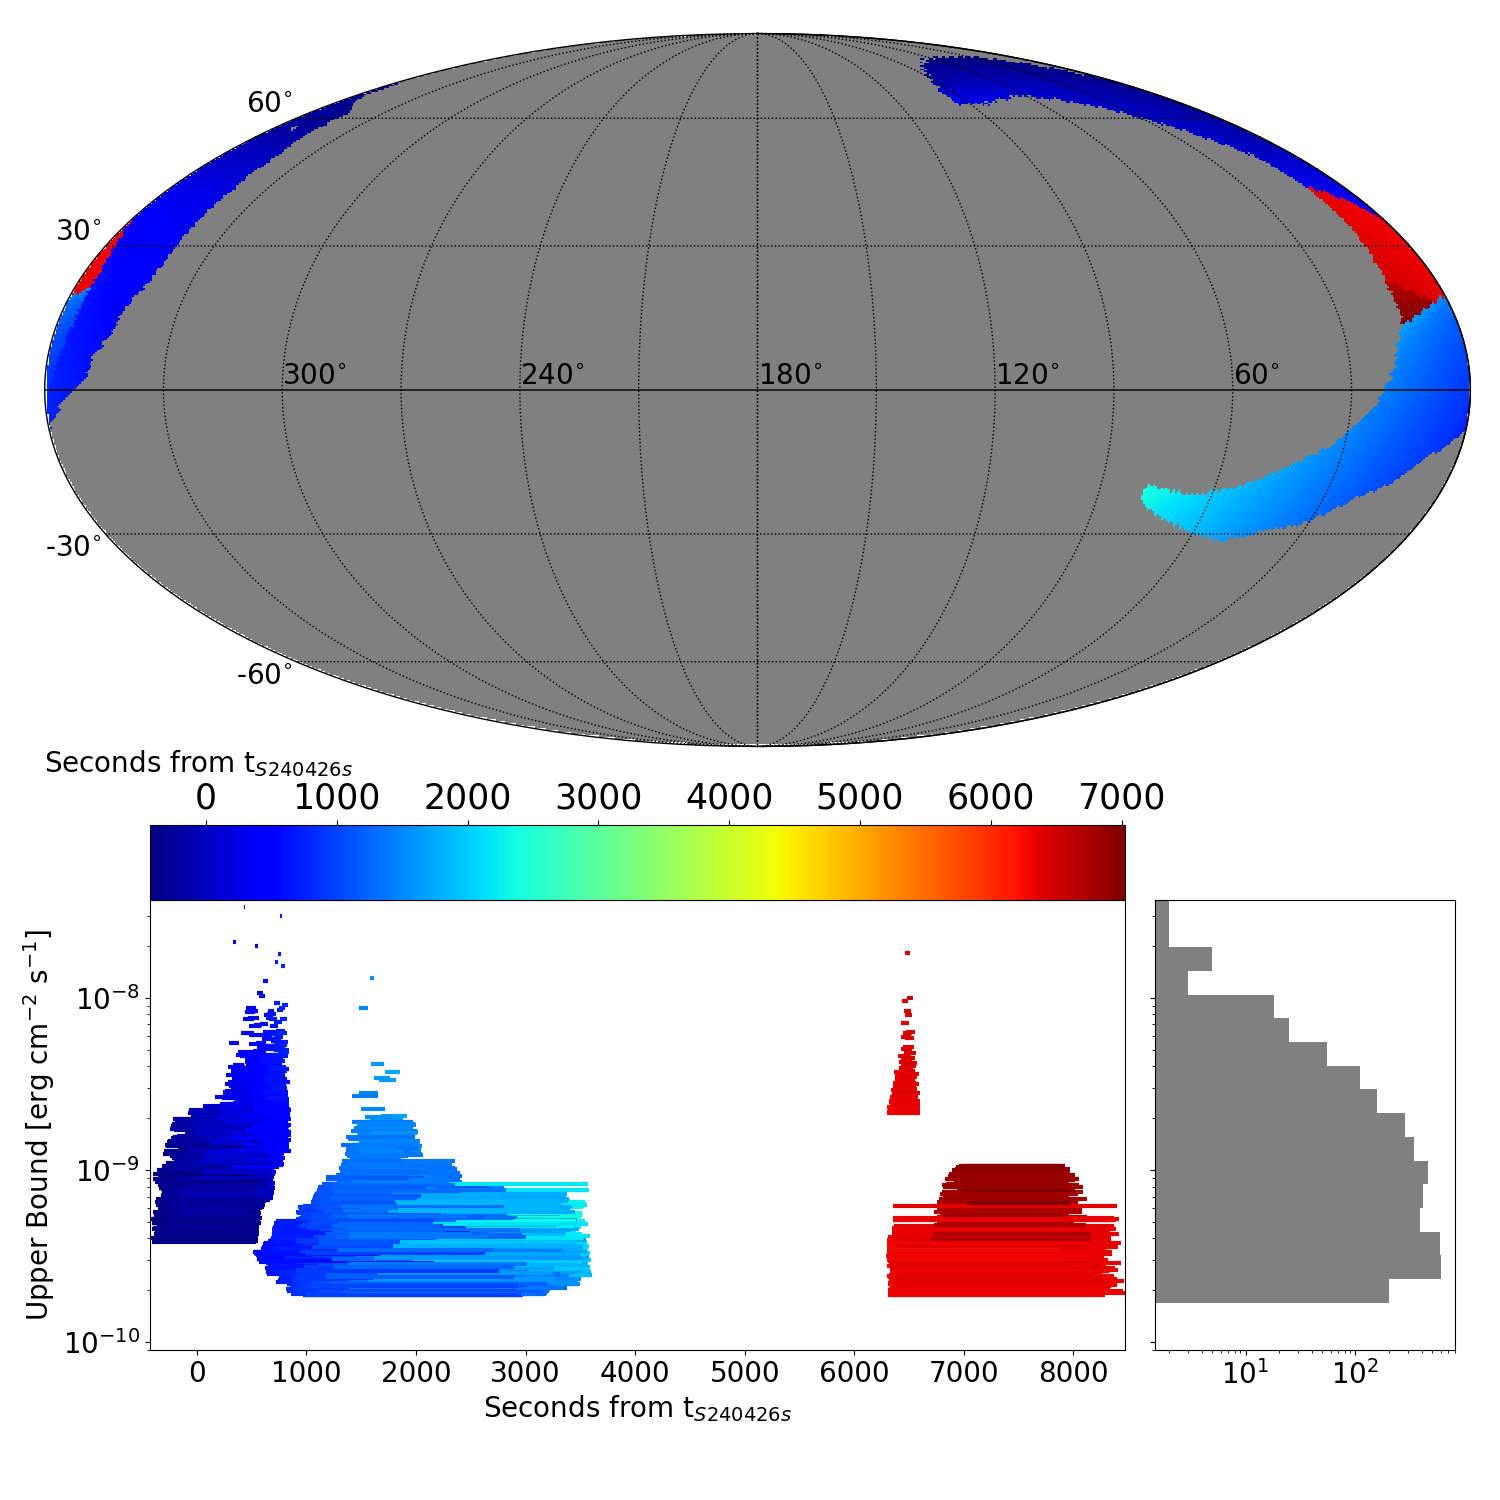
| ADAPTIVE TIME INTERVAL ANALYSIS |
|
|
|
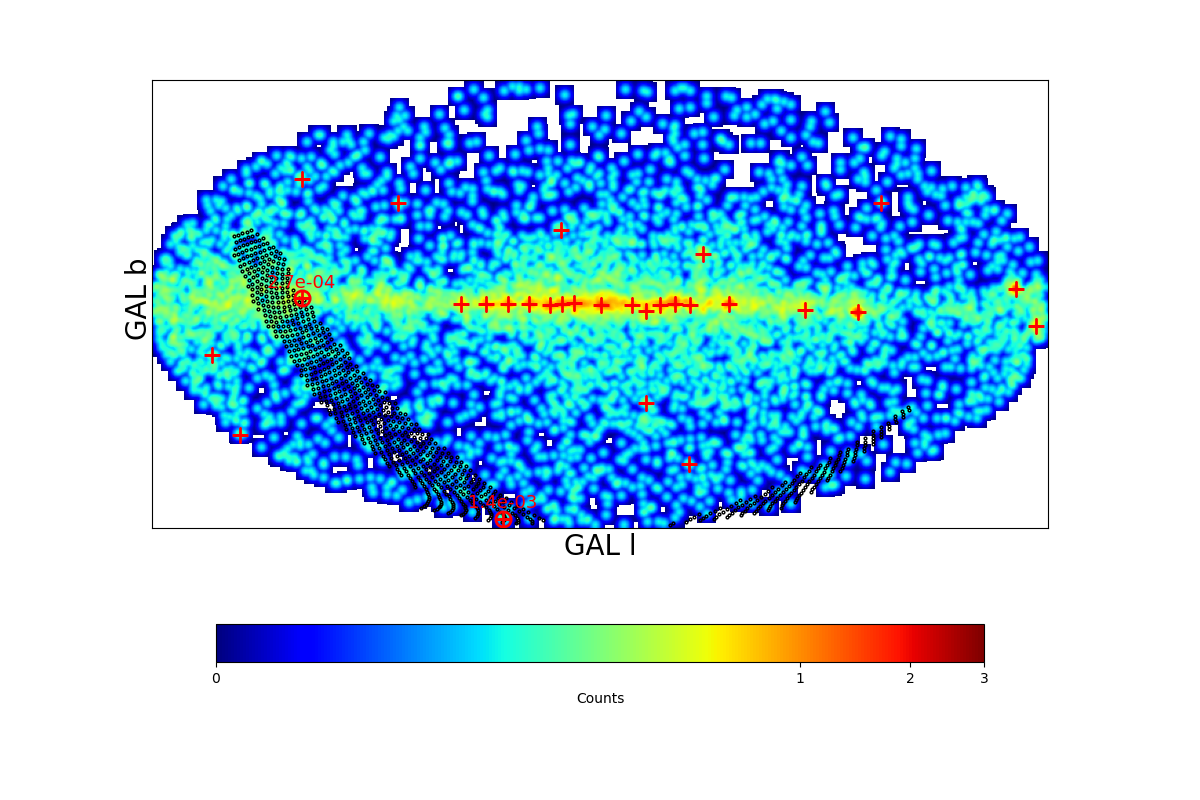
DISTRIBUTION OF THE UPPER BOUNDS |
|
|
| TS MAXIMUM |
|---|
|
TS = 20.3 |
Ra | 2.33° |
| Dec | 46.57° |
| Nearby 4FGL sources | 2 |
| 4FGL J0006.6+4618 | Δ=0.53° |
| 4FGL J0008.0+4711 | Δ=0.66° |
| Sun in this pixel? | False |
| Moon in this pixel? | False |
| LIST OF OTHER TS > 25.0 |
|---|
|
|
TS MAP |

|
|
| FLUX UB EXTREMES |
| UB min | 1.87 e-10 erg cm-2 s-1 |
| UB max | 33.6 e-9 erg cm-2 s-1 |
|
|
UL MAP |
|
|
|
|
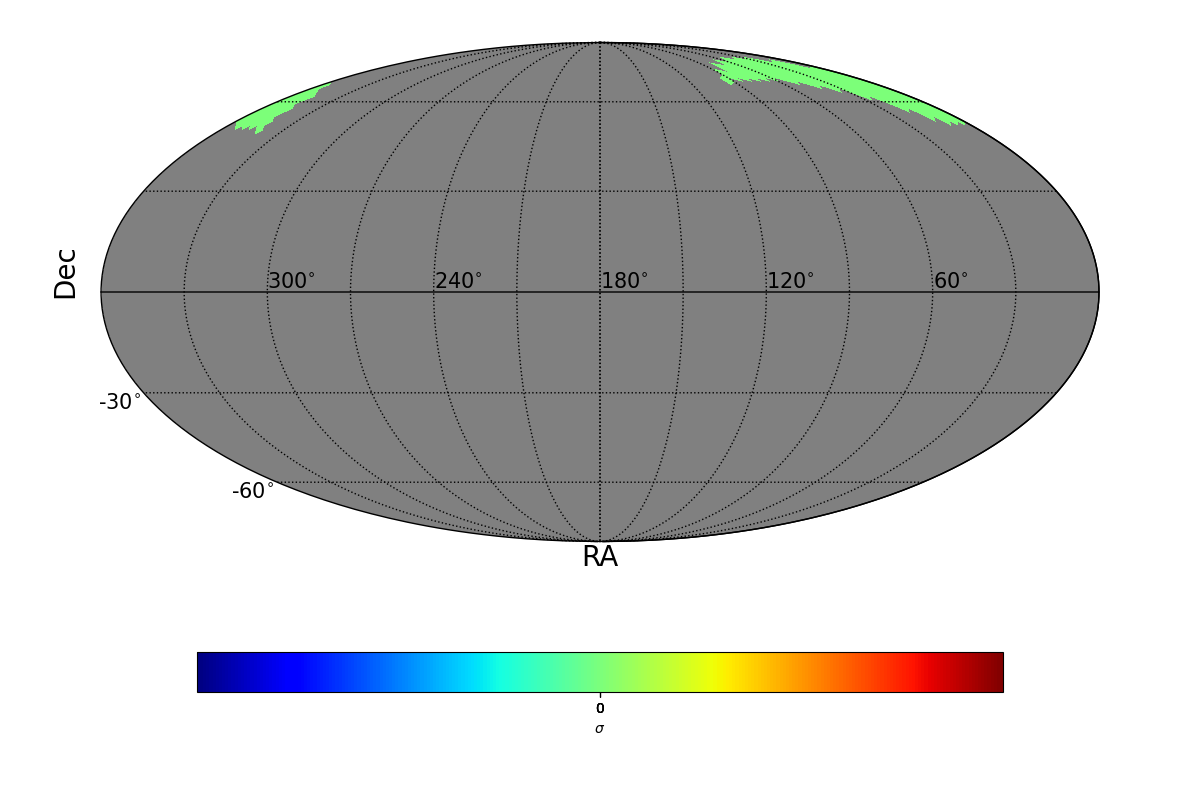
| SIGMA MAXIMUM |
|---|
|
SIGMA = 0.0 |
Ra | 28.12° |
| Dec | 78.28° |
| Nearby 4FGL sources | 0 |
| Sun in this pixel? | False |
| Moon in this pixel? | False |
| LIST OF OTHER SIGMA > 4 |
|---|
|
|
SIGMA MAP |
|
|
|
|
|
|
COUNT MAP |
|
|
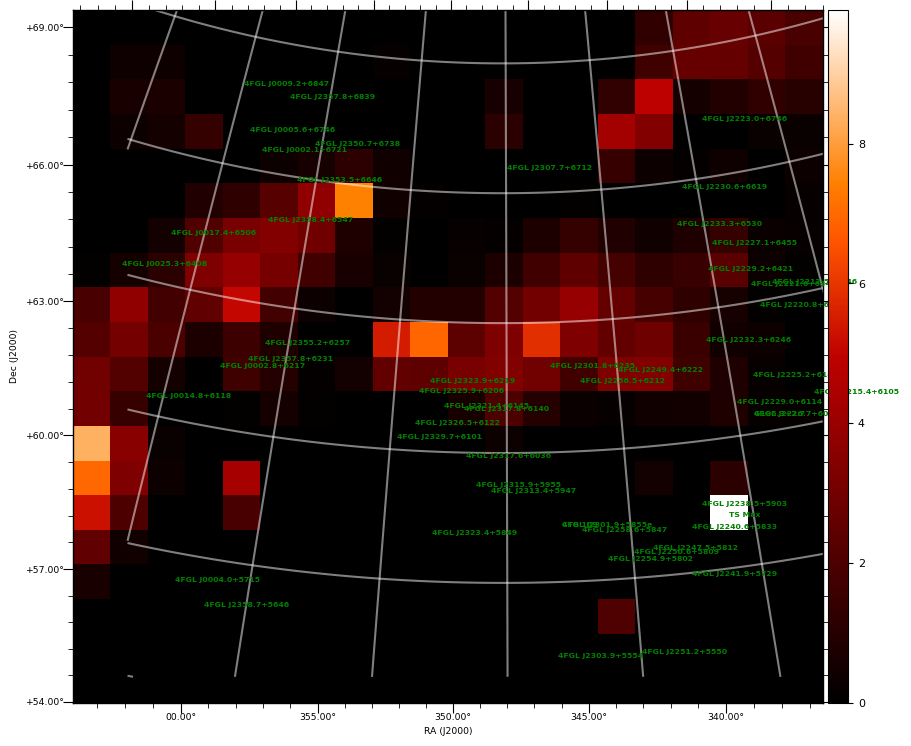
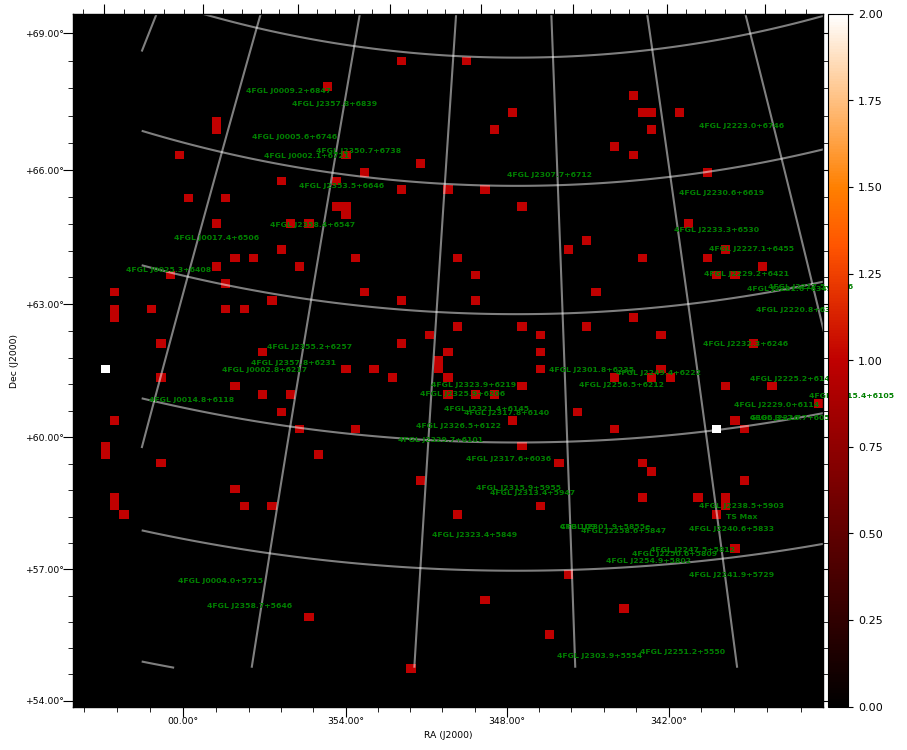
| TS MAXIMUM |
|---|
|
TS = 9.9 |
Ra | 338.58° |
| Dec | 58.69° |
| Nearby 4FGL sources | 2 |
| 4FGL J2238.5+5903 | Δ=0.65° |
| 4FGL J2240.6+5833 | Δ=0.84° |
| Sun in this pixel? | False |
| Moon in this pixel? | False |
|
|
TS MAP |
COUNT MAP |
|
|
|
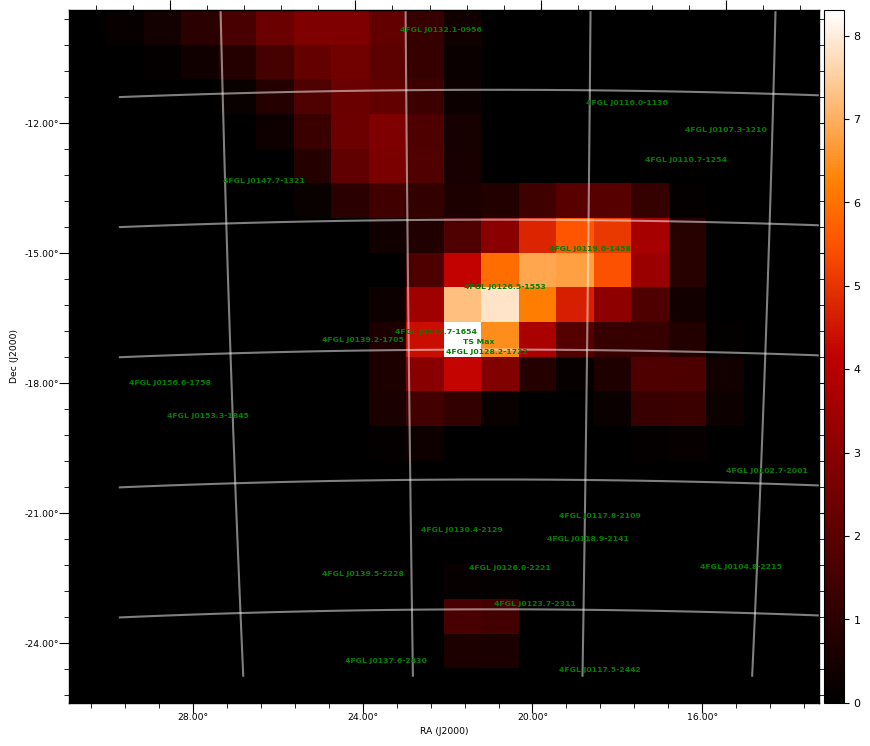
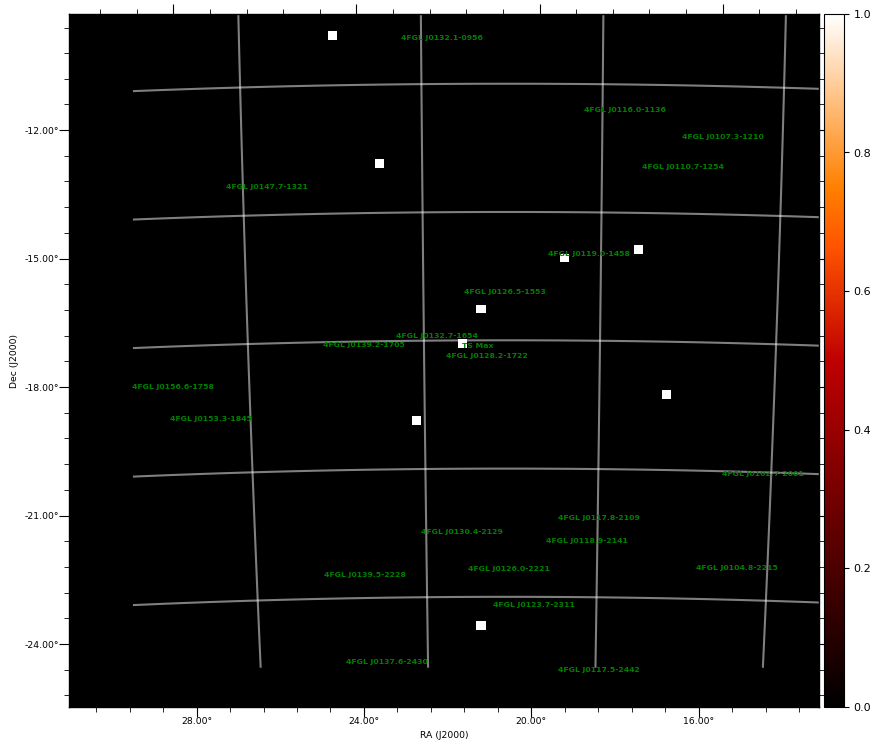
| TS MAXIMUM |
|---|
|
TS = 8.3 |
Ra | 21.67° |
| Dec | -17.15° |
| Nearby 4FGL sources | 1 |
| 4FGL J0128.2-1722 | Δ=0.43° |
| Sun in this pixel? | False |
| Moon in this pixel? | False |
|
|
TS MAP |
COUNT MAP |
|
|
|
|
|