| GWFUP ANALYSIS REPORT FOR GW S231005ah |
|
|
|
| SUMMARY | |
| Name | S231005ah |
| Trigger MET | 718190154.47 |
| Date | 2023-10-05 |
| Time | 09:15:49 |
| In SAA? | False |
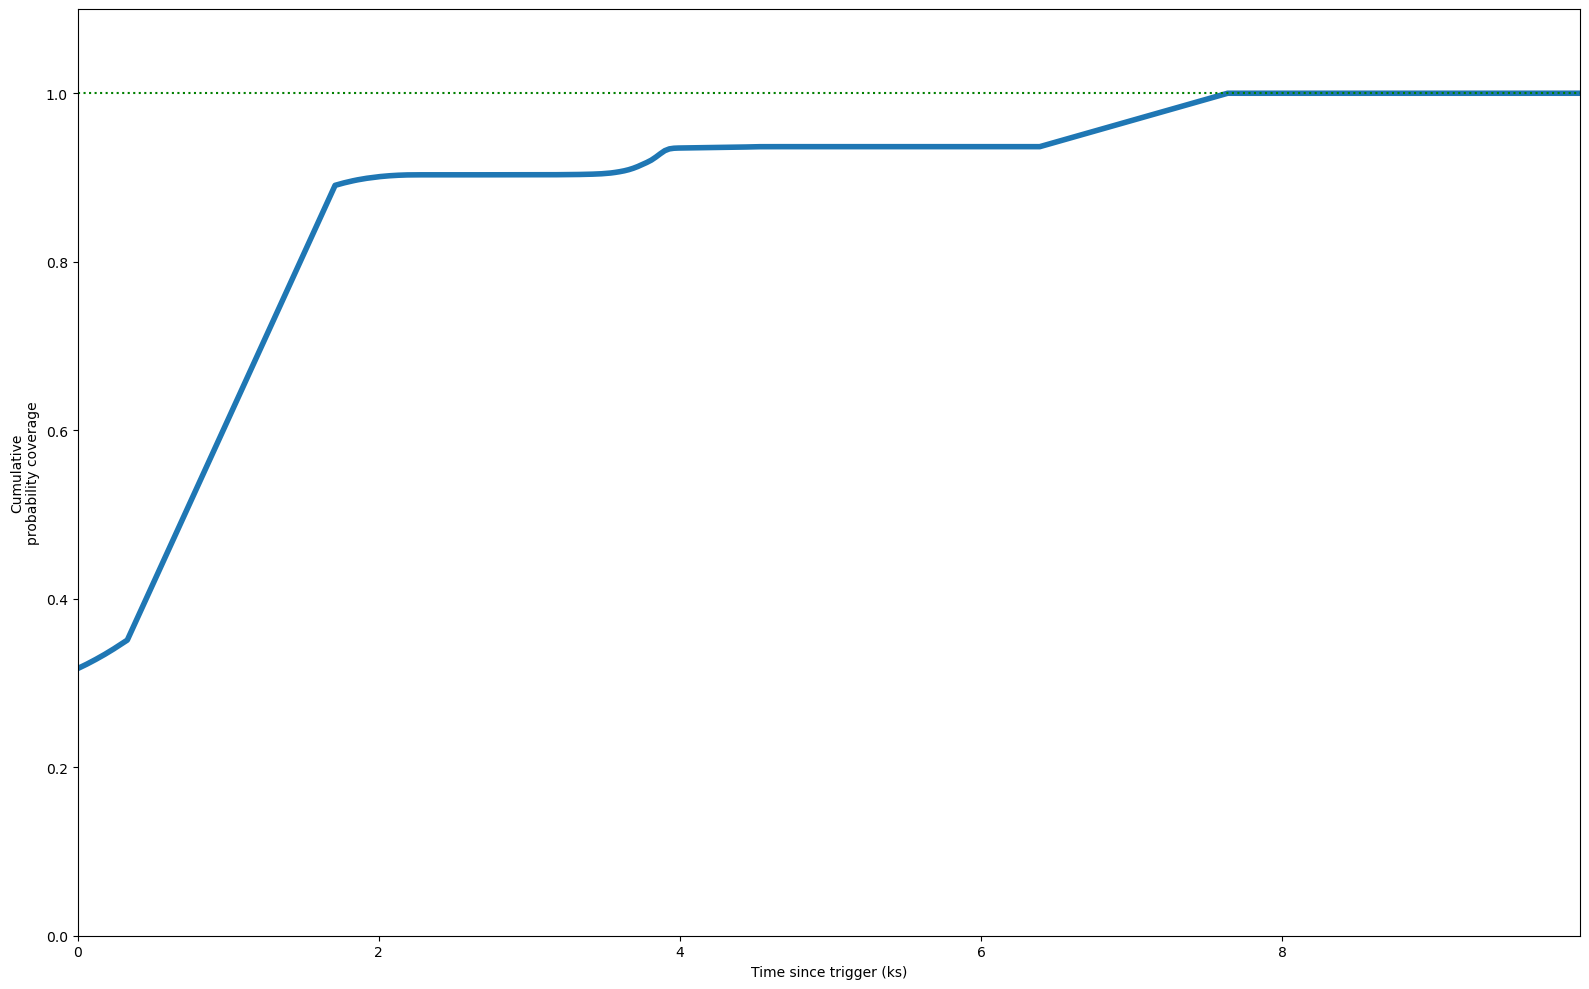
| Inst Coverage | 31.7% |
| T Max Coverage | 7.6 ks (100.0%) |
| E Min | 100.0 MeV |
| E Max | 100000.0 MeV |
| T Start | 0.0 s |
| T Stop | 10000.0 s |
| Theta Max | 65.0° |
| Z Max | 100.0° |
| ROI | 8.0° |
| IRF | p8_source |
| Galactic Model | template |
| Strategy | time |
| Particle Model | isotr template |
| NSide | 64 |
| Version | v02 |
|
| COVERAGE |
|
|
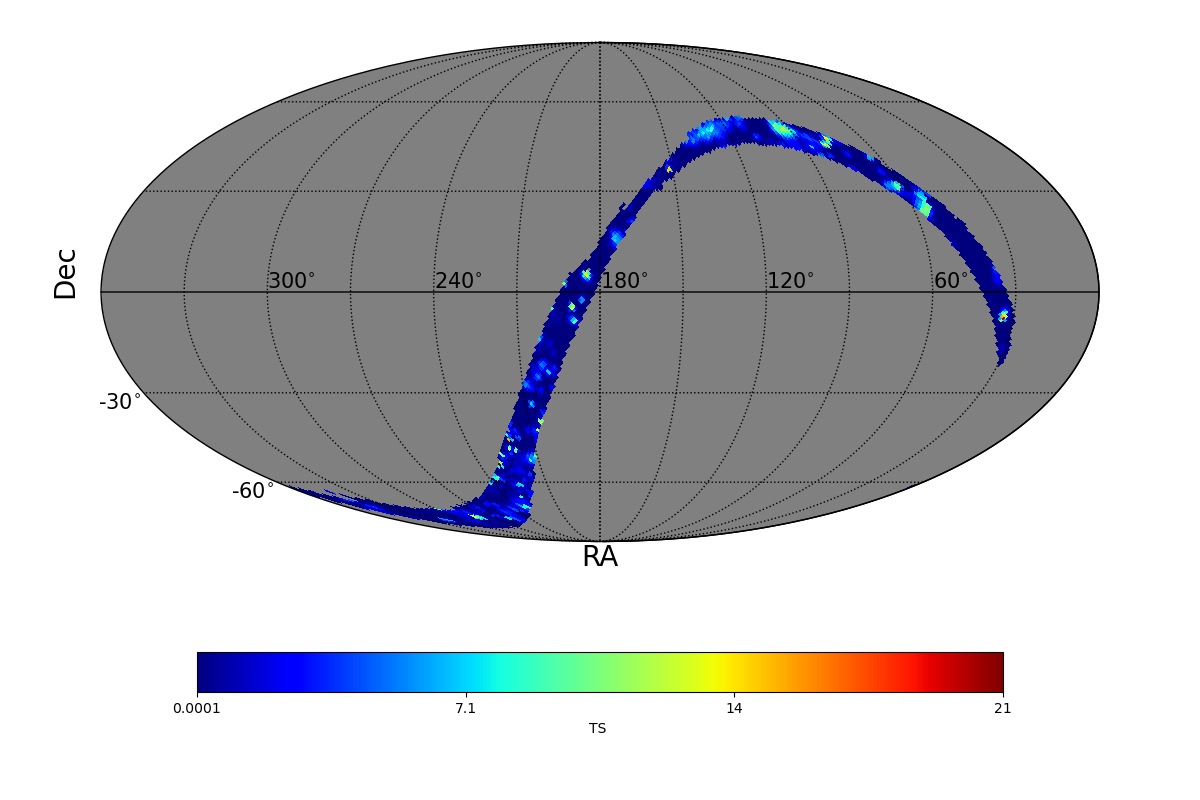
| FIXED TIME INTERVAL ANALYSIS |
|
| TS MAXIMUM |
|---|
|
TS = 21.3 |
Ra | 230.51° |
| Dec | -53.57° |
| Nearby 4FGL sources | 0 |
| Sun in this pixel? | False |
| Moon in this pixel? | False |
| LIST OF OTHER TS > 25.0 |
|---|
|
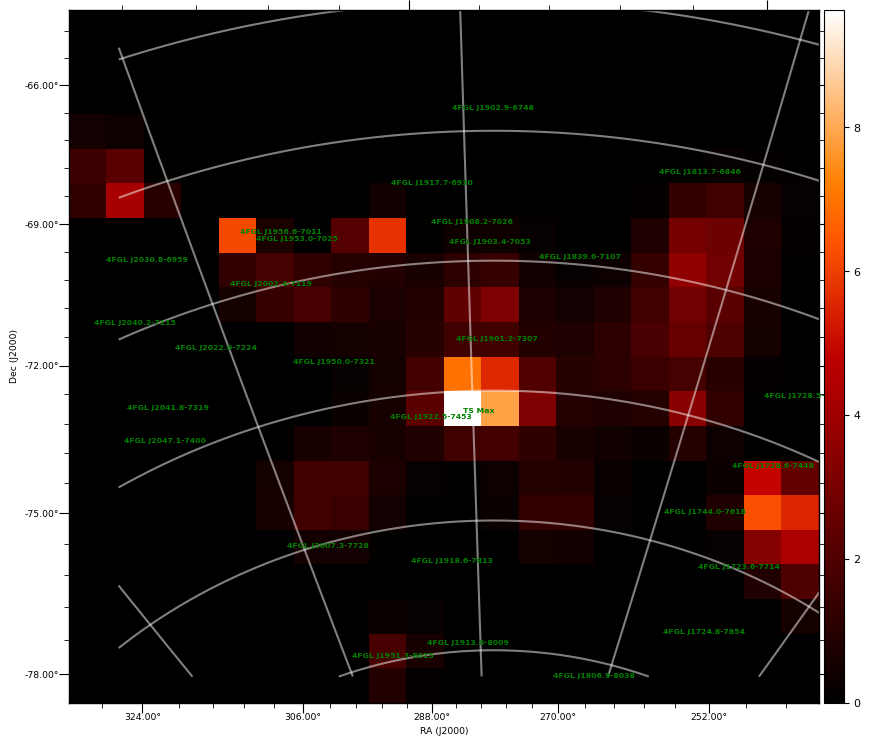
| TS MAP |
|
|
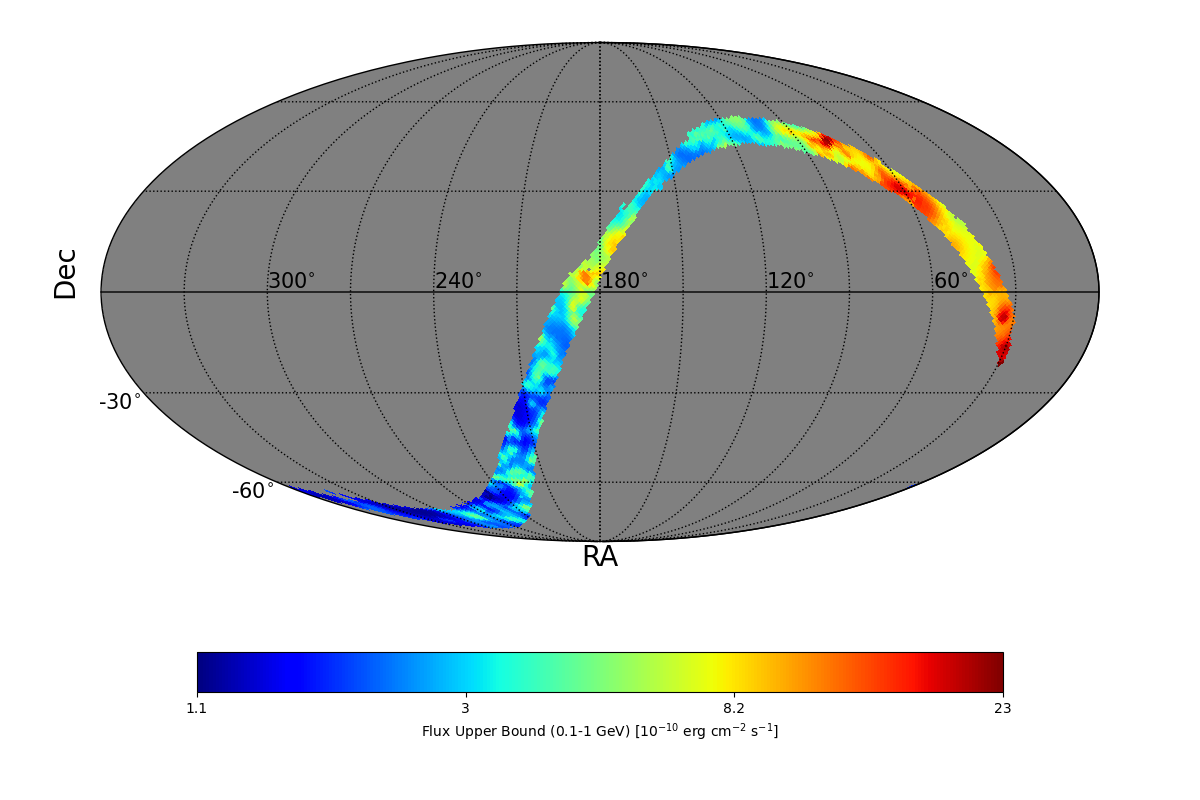
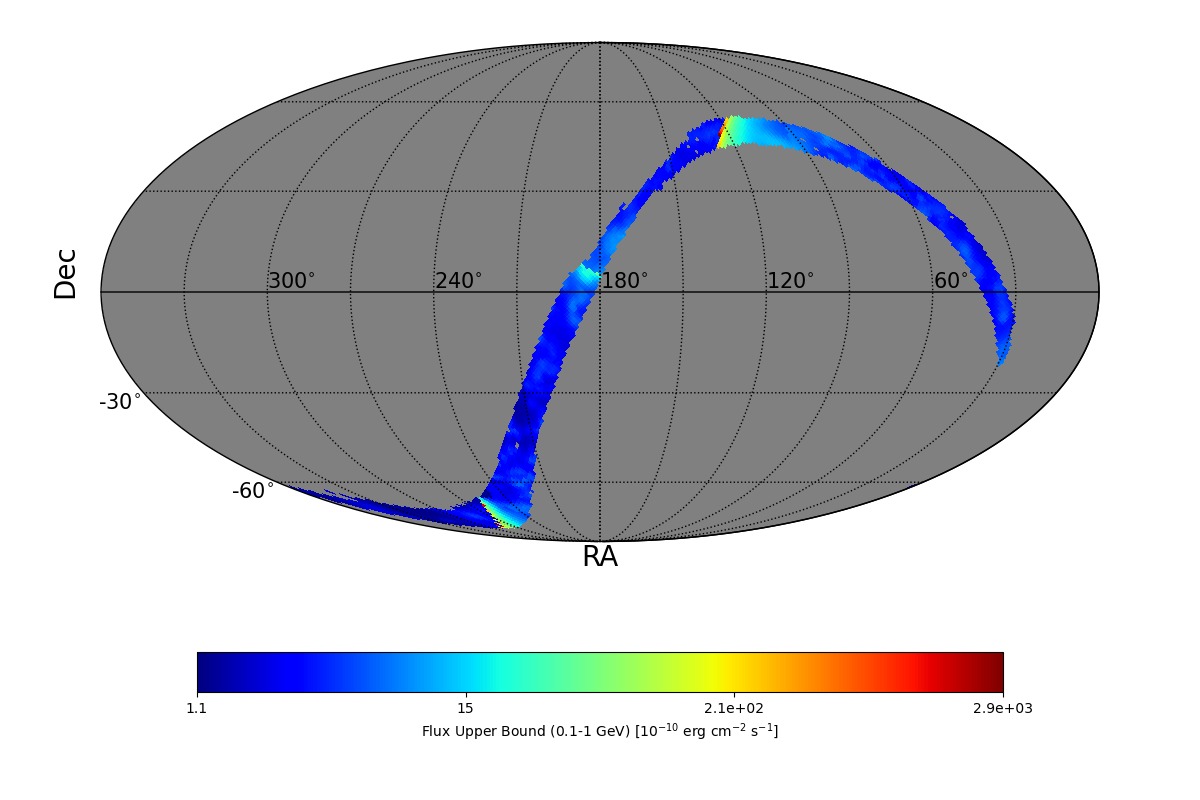
| FLUX UB EXTREMES |
| UB min | 1.07 e-10 erg cm-2 s-1 |
| UB max | 2.3 e-9 erg cm-2 s-1 |
| BAYESIAN FLUX UB (CL=95%) |
| Photon flux | 21.48 e-7 ph cm-2 s-1 |
| Energy flux | 8.81 e-10 erg cm-2 s-1 |
|
| UL MAP |
|
|
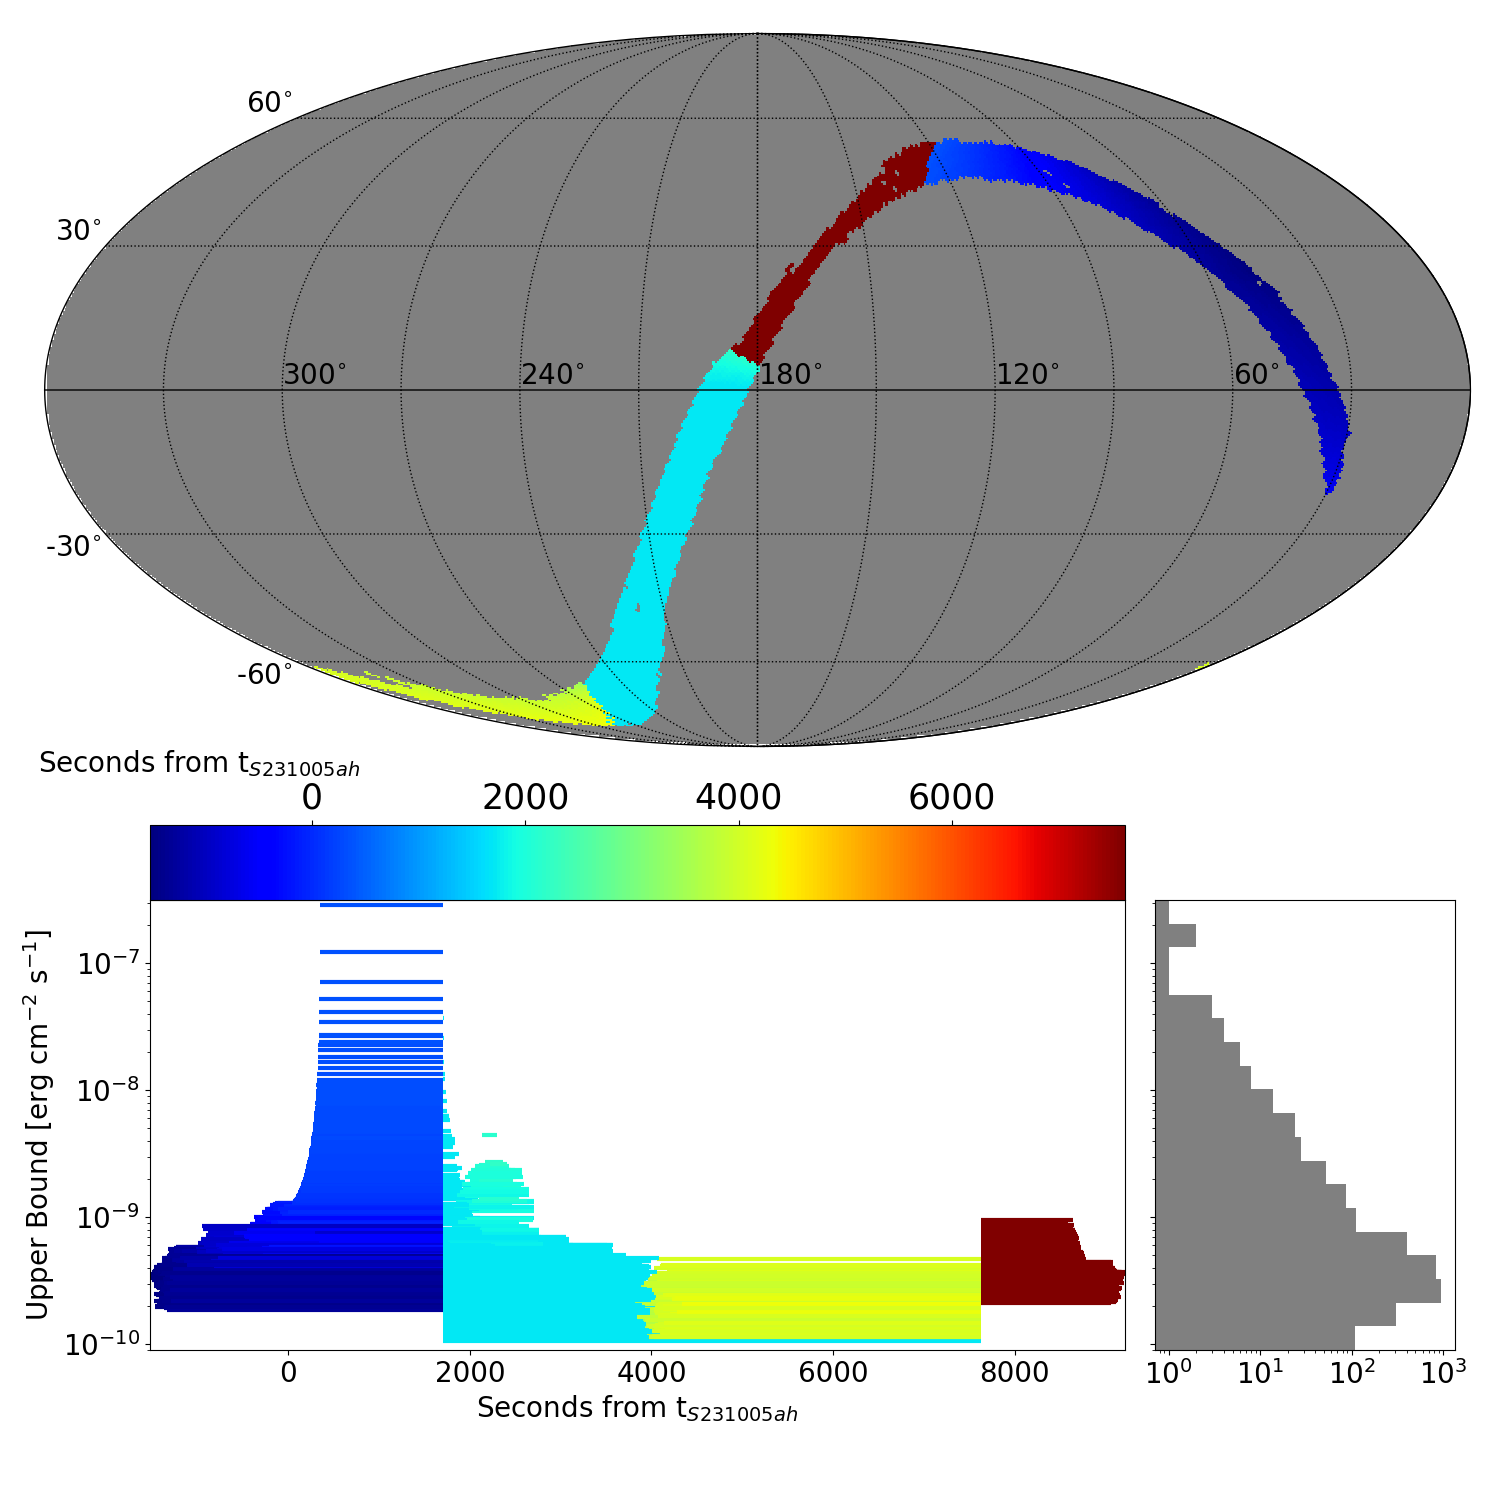
| ADAPTIVE TIME INTERVAL ANALYSIS |
|
|
|
DISTRIBUTION OF THE UPPER BOUNDS |
|
|
| TS MAXIMUM |
|---|
|
TS = 21.5 |
Ra | 230.51° |
| Dec | -53.57° |
| Nearby 4FGL sources | 0 |
| Sun in this pixel? | False |
| Moon in this pixel? | False |
| LIST OF OTHER TS > 25.0 |
|---|
|
|
TS MAP |

|
|
| FLUX UB EXTREMES |
| UB min | 1.06 e-10 erg cm-2 s-1 |
| UB max | 286.0 e-9 erg cm-2 s-1 |
|
|
UL MAP |
|
|
|
|
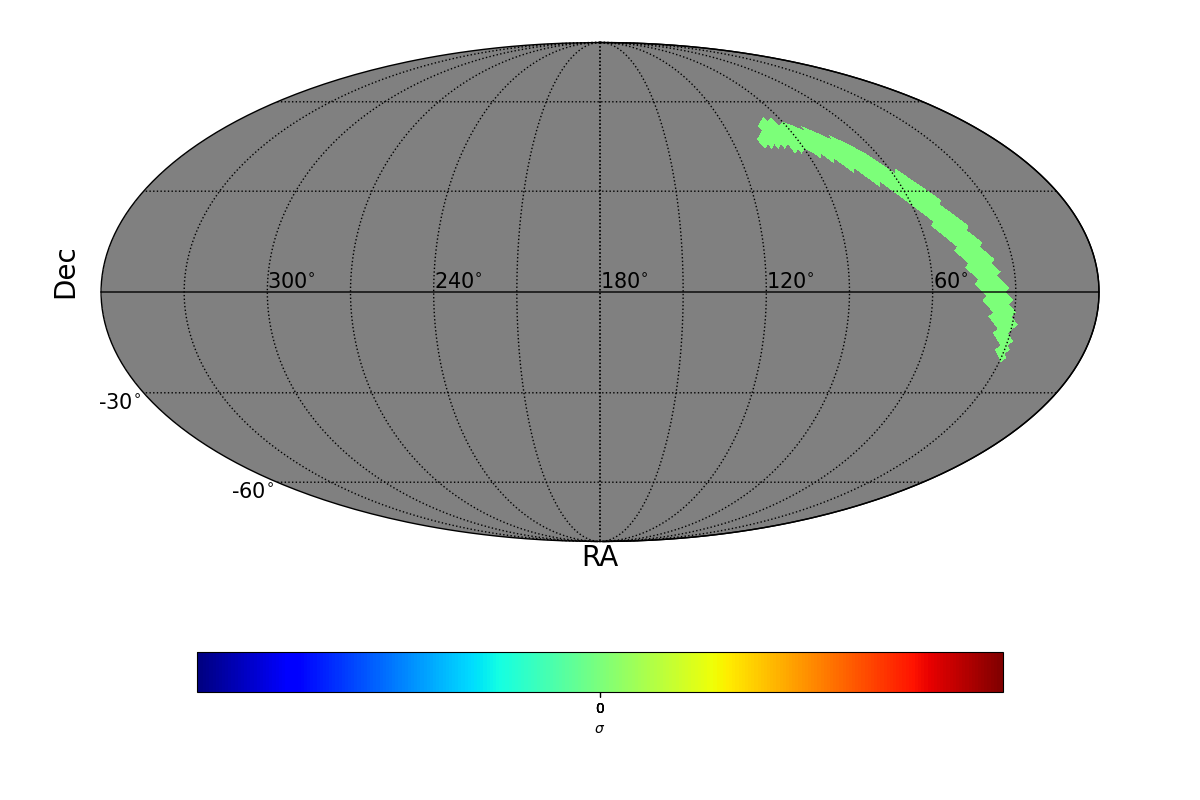
| SIGMA MAXIMUM |
|---|
|
SIGMA = 0.0 |
Ra | 95.4° |
| Dec | 52.8° |
| Nearby 4FGL sources | 0 |
| Sun in this pixel? | False |
| Moon in this pixel? | False |
| LIST OF OTHER SIGMA > 4 |
|---|
|
|
SIGMA MAP |
|
|
|
|
|
|
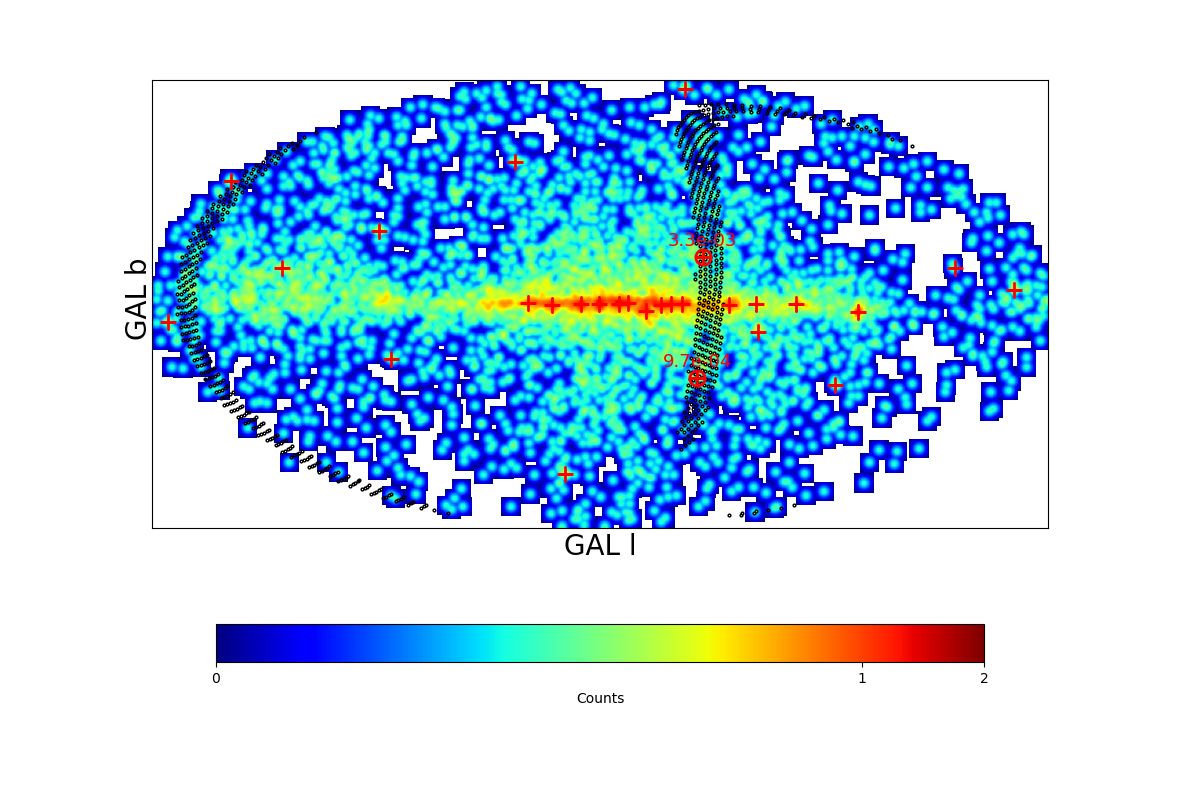
COUNT MAP |
|
|
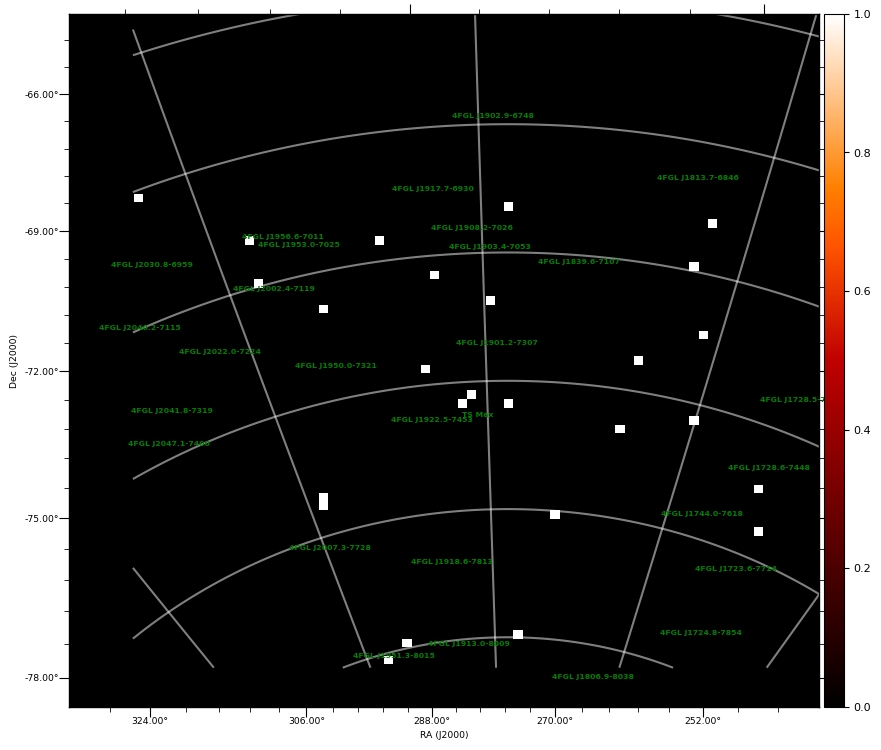
| TS MAXIMUM |
|---|
|
TS = 9.6 |
Ra | 284.7° |
| Dec | -74.8° |
| Nearby 4FGL sources | 0 |
| Sun in this pixel? | False |
| Moon in this pixel? | False |
|
|
TS MAP |
COUNT MAP |
|
|
|
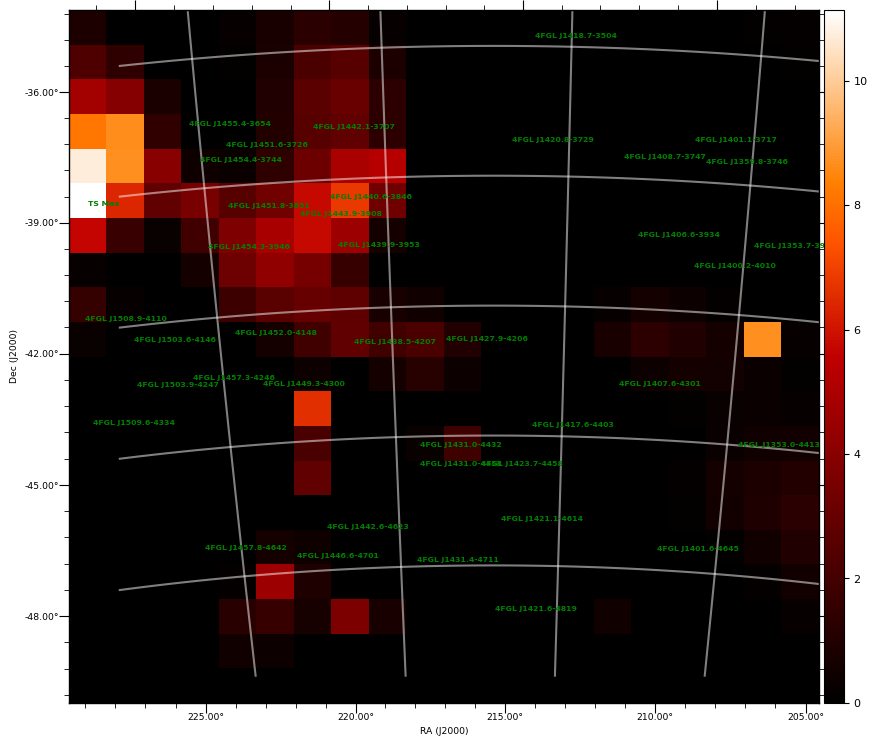
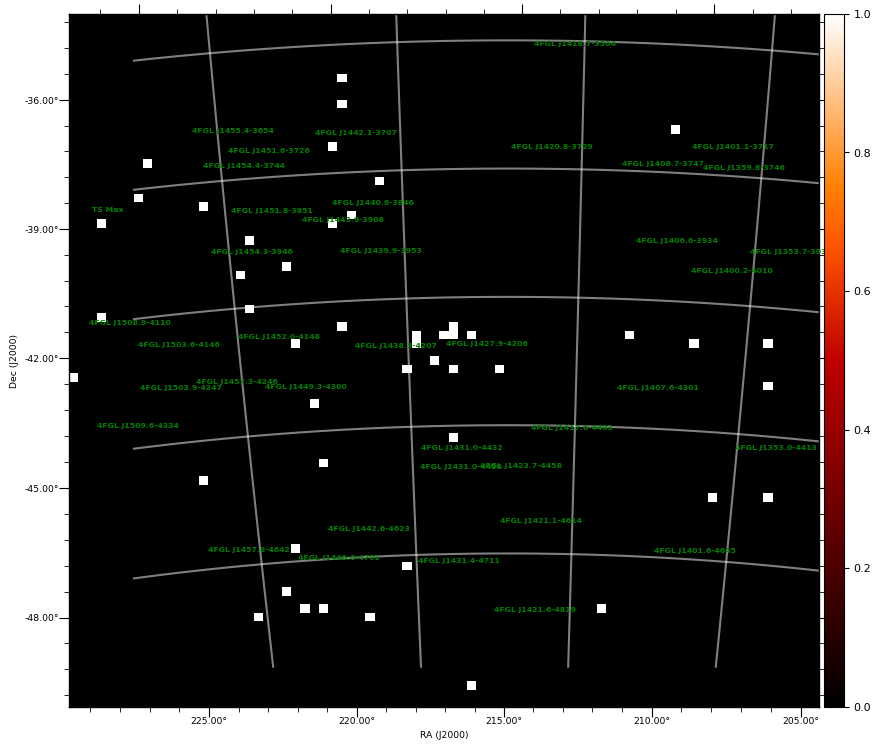
| TS MAXIMUM |
|---|
|
TS = 11.1 |
Ra | 226.78° |
| Dec | -38.53° |
| Nearby 4FGL sources | 0 |
| Sun in this pixel? | False |
| Moon in this pixel? | False |
|
|
TS MAP |
COUNT MAP |
|
|
|
|
|