| GWFUP ANALYSIS REPORT FOR GW S230927l |
|
|
|
| SUMMARY | |
| Name | S230927l |
| Trigger MET | 717482254.1 |
| Date | 2023-09-27 |
| Time | 04:37:29 |
| In SAA? | False |
| Inst Coverage | 2.6% |
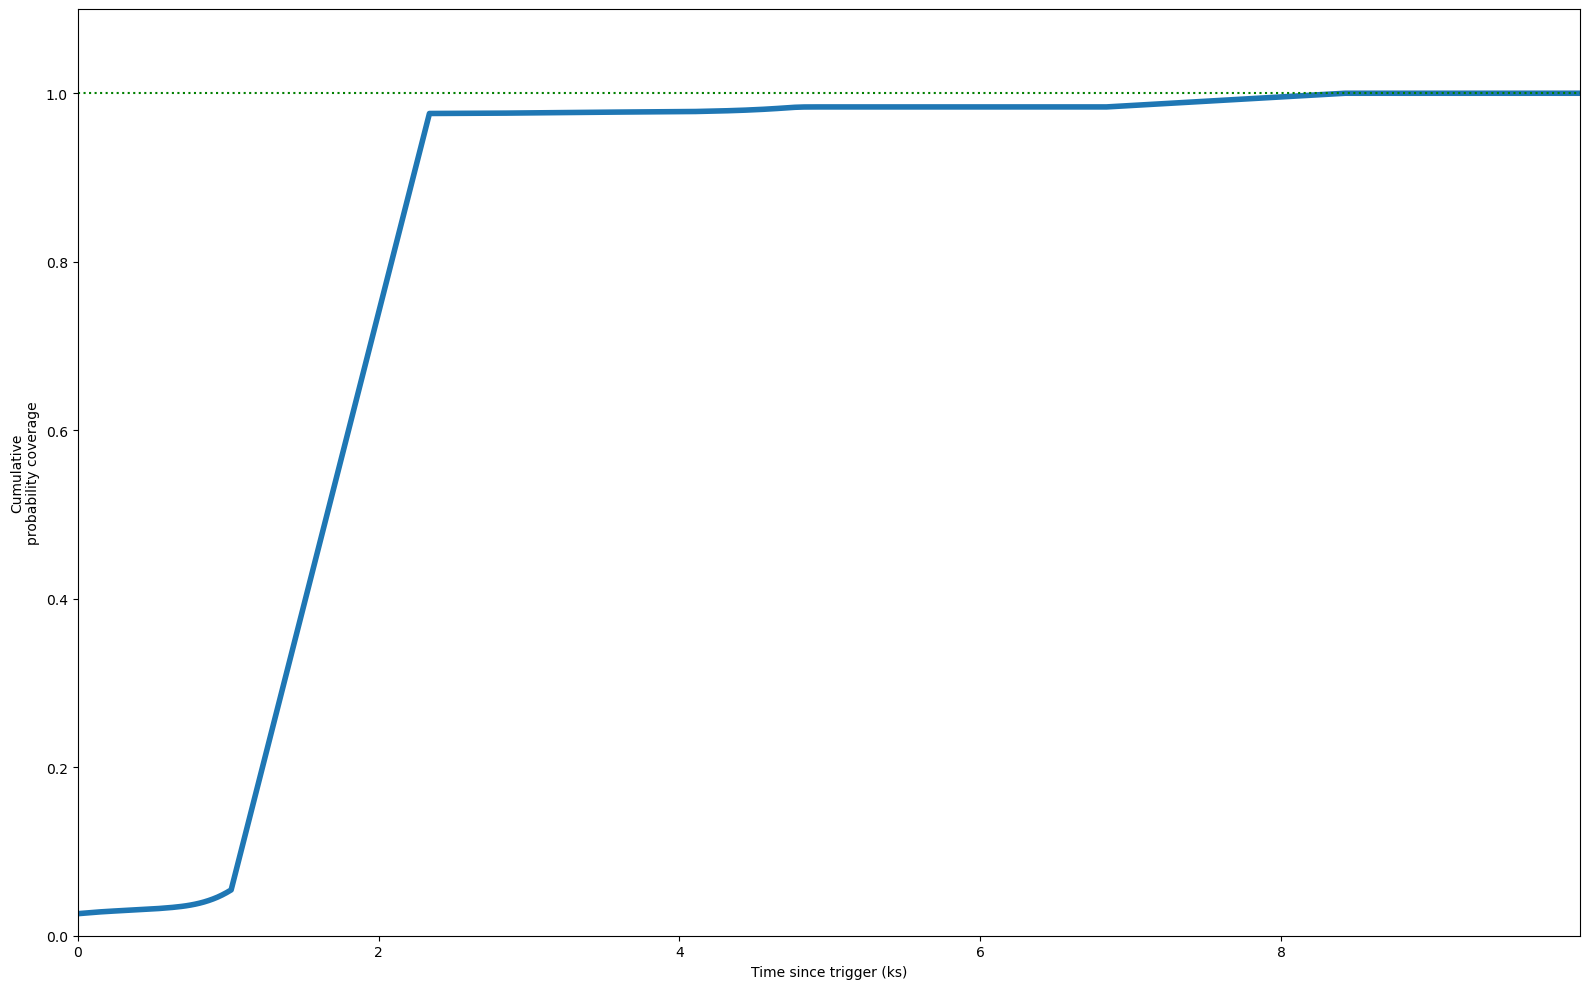
| T Max Coverage | 8.4 ks (100.0%) |
| E Min | 100.0 MeV |
| E Max | 100000.0 MeV |
| T Start | 0.0 s |
| T Stop | 10000.0 s |
| Theta Max | 65.0° |
| Z Max | 100.0° |
| ROI | 8.0° |
| IRF | p8_source |
| Galactic Model | template |
| Strategy | time |
| Particle Model | isotr template |
| NSide | 64 |
| Version | v02 |
|
| COVERAGE |
|
|
| FIXED TIME INTERVAL ANALYSIS |
|
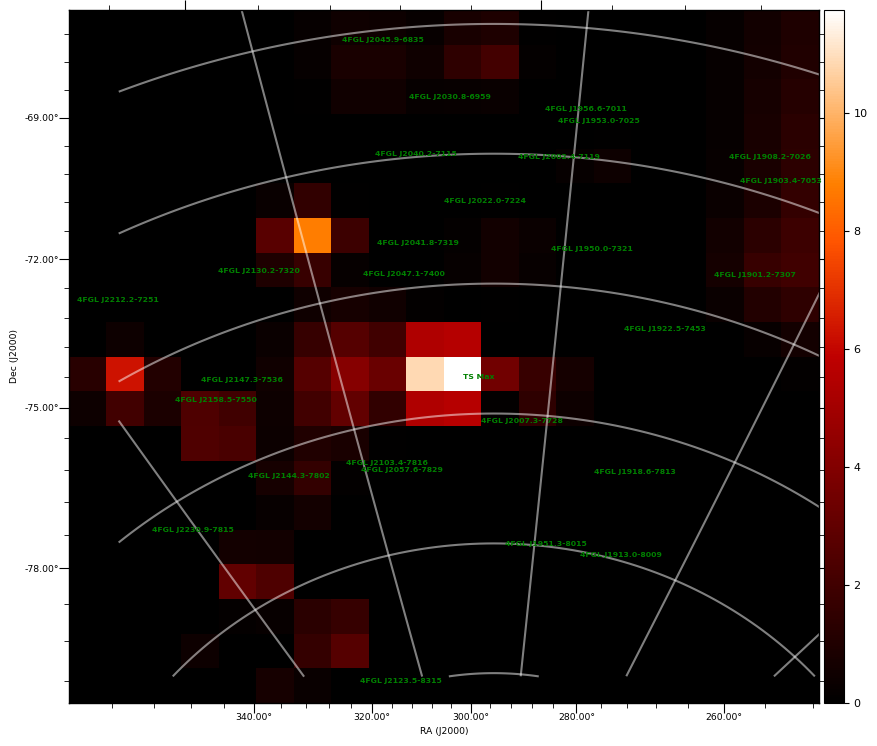
| TS MAXIMUM |
|---|
|
TS = 25.2 |
Ra | 305.53° |
| Dec | -76.08° |
| Nearby 4FGL sources | 0 |
| Sun in this pixel? | False |
| Moon in this pixel? | False |
| LIST OF OTHER TS > 25.0 |
|---|
|
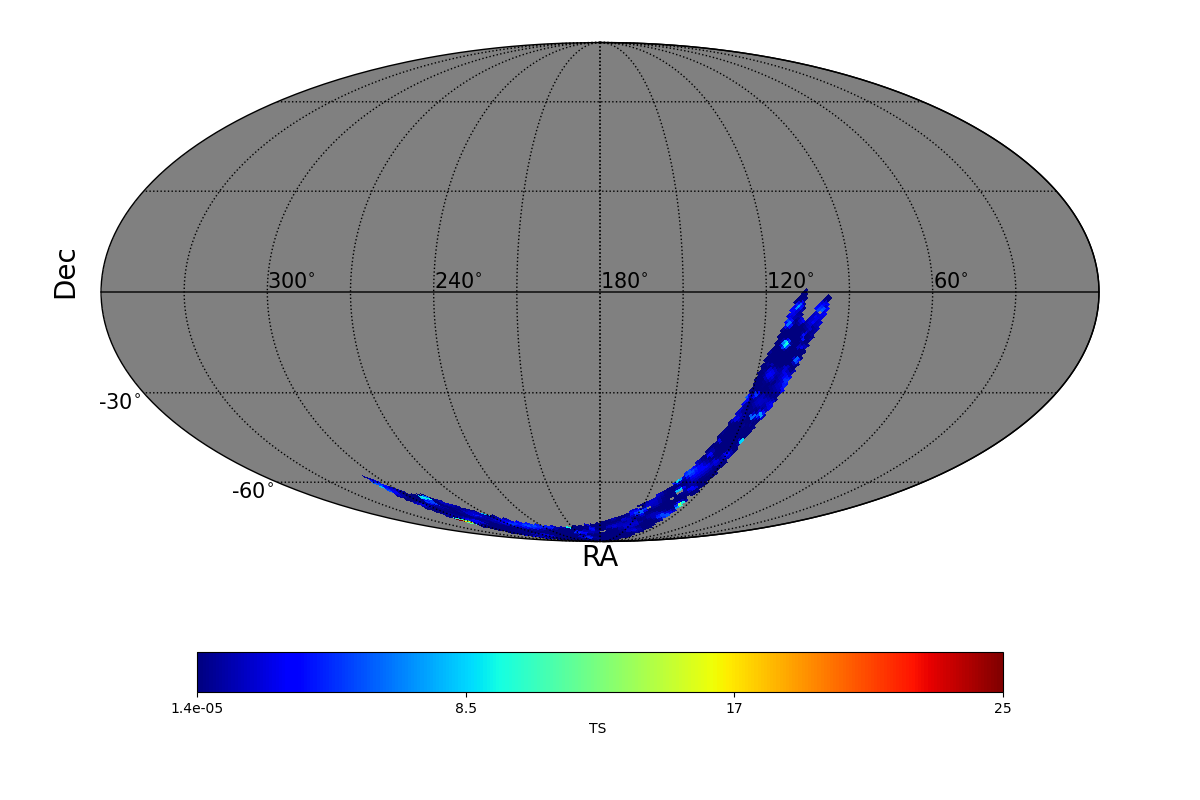
| TS MAP |

|
|
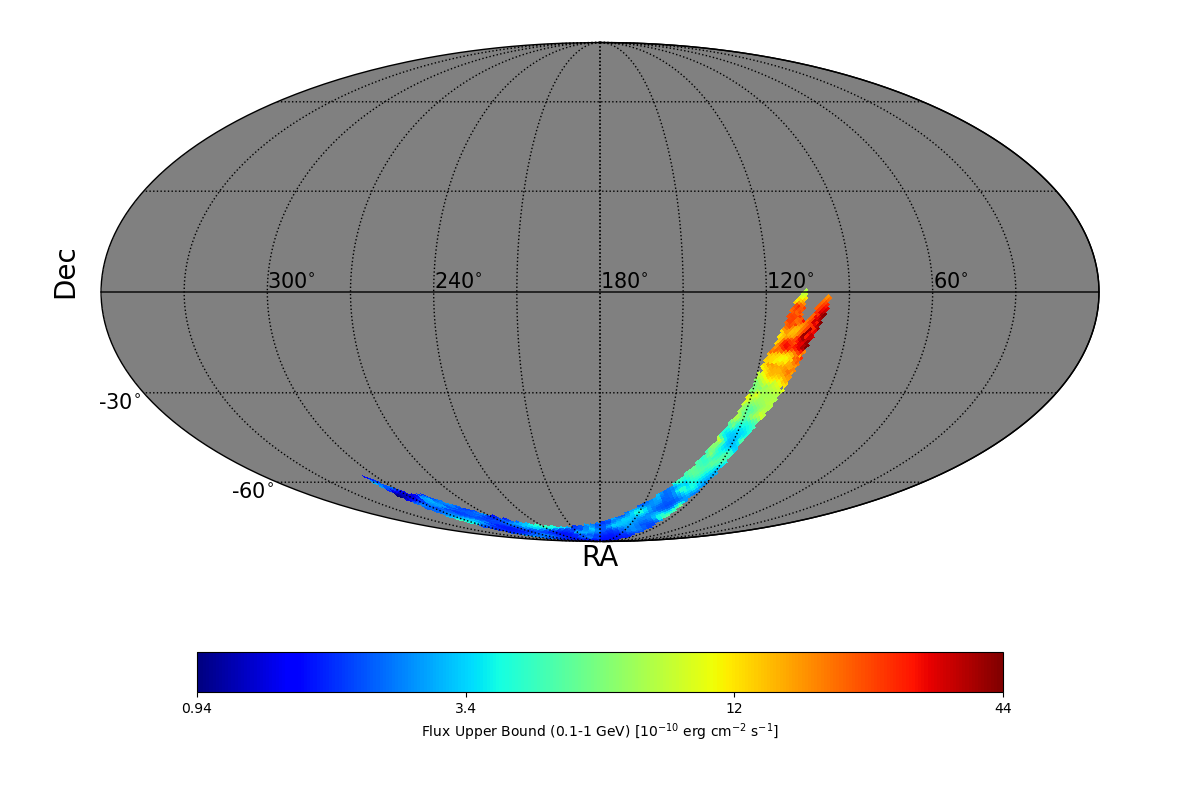
| FLUX UB EXTREMES |
| UB min | 0.94 e-10 erg cm-2 s-1 |
| UB max | 4.4 e-9 erg cm-2 s-1 |
| BAYESIAN FLUX UB (CL=95%) |
| Photon flux | 34.4 e-7 ph cm-2 s-1 |
| Energy flux | 13.03 e-10 erg cm-2 s-1 |
|
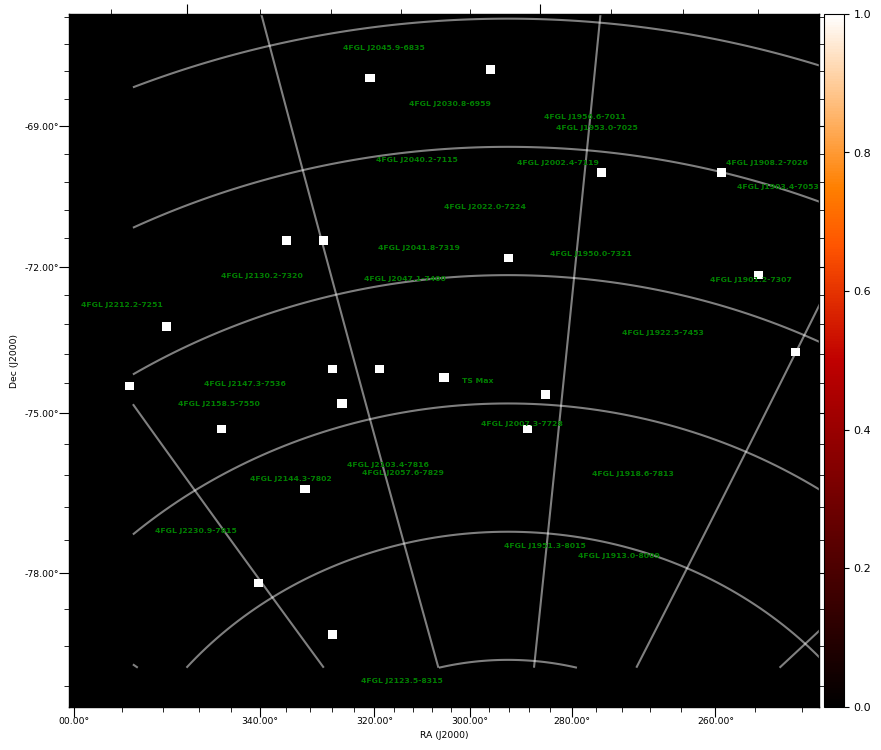
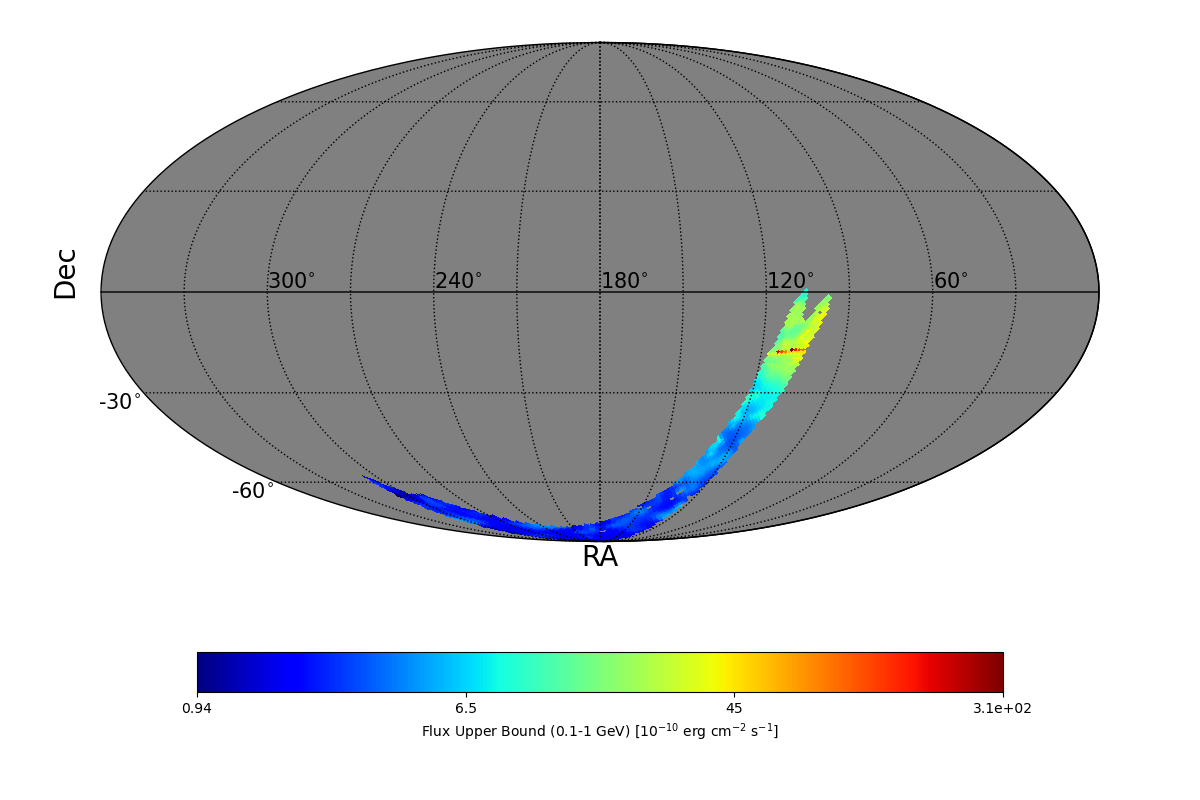
| UL MAP |
|
|
| TS MAXIMUM |
|---|
|
TS = 11.7 |
Ra | 303.82° |
| Dec | -76.47° |
| Nearby 4FGL sources | 0 |
| Sun in this pixel? | False |
| Moon in this pixel? | False |
|
|
TS MAP |
COUNT MAP |
|
|
|
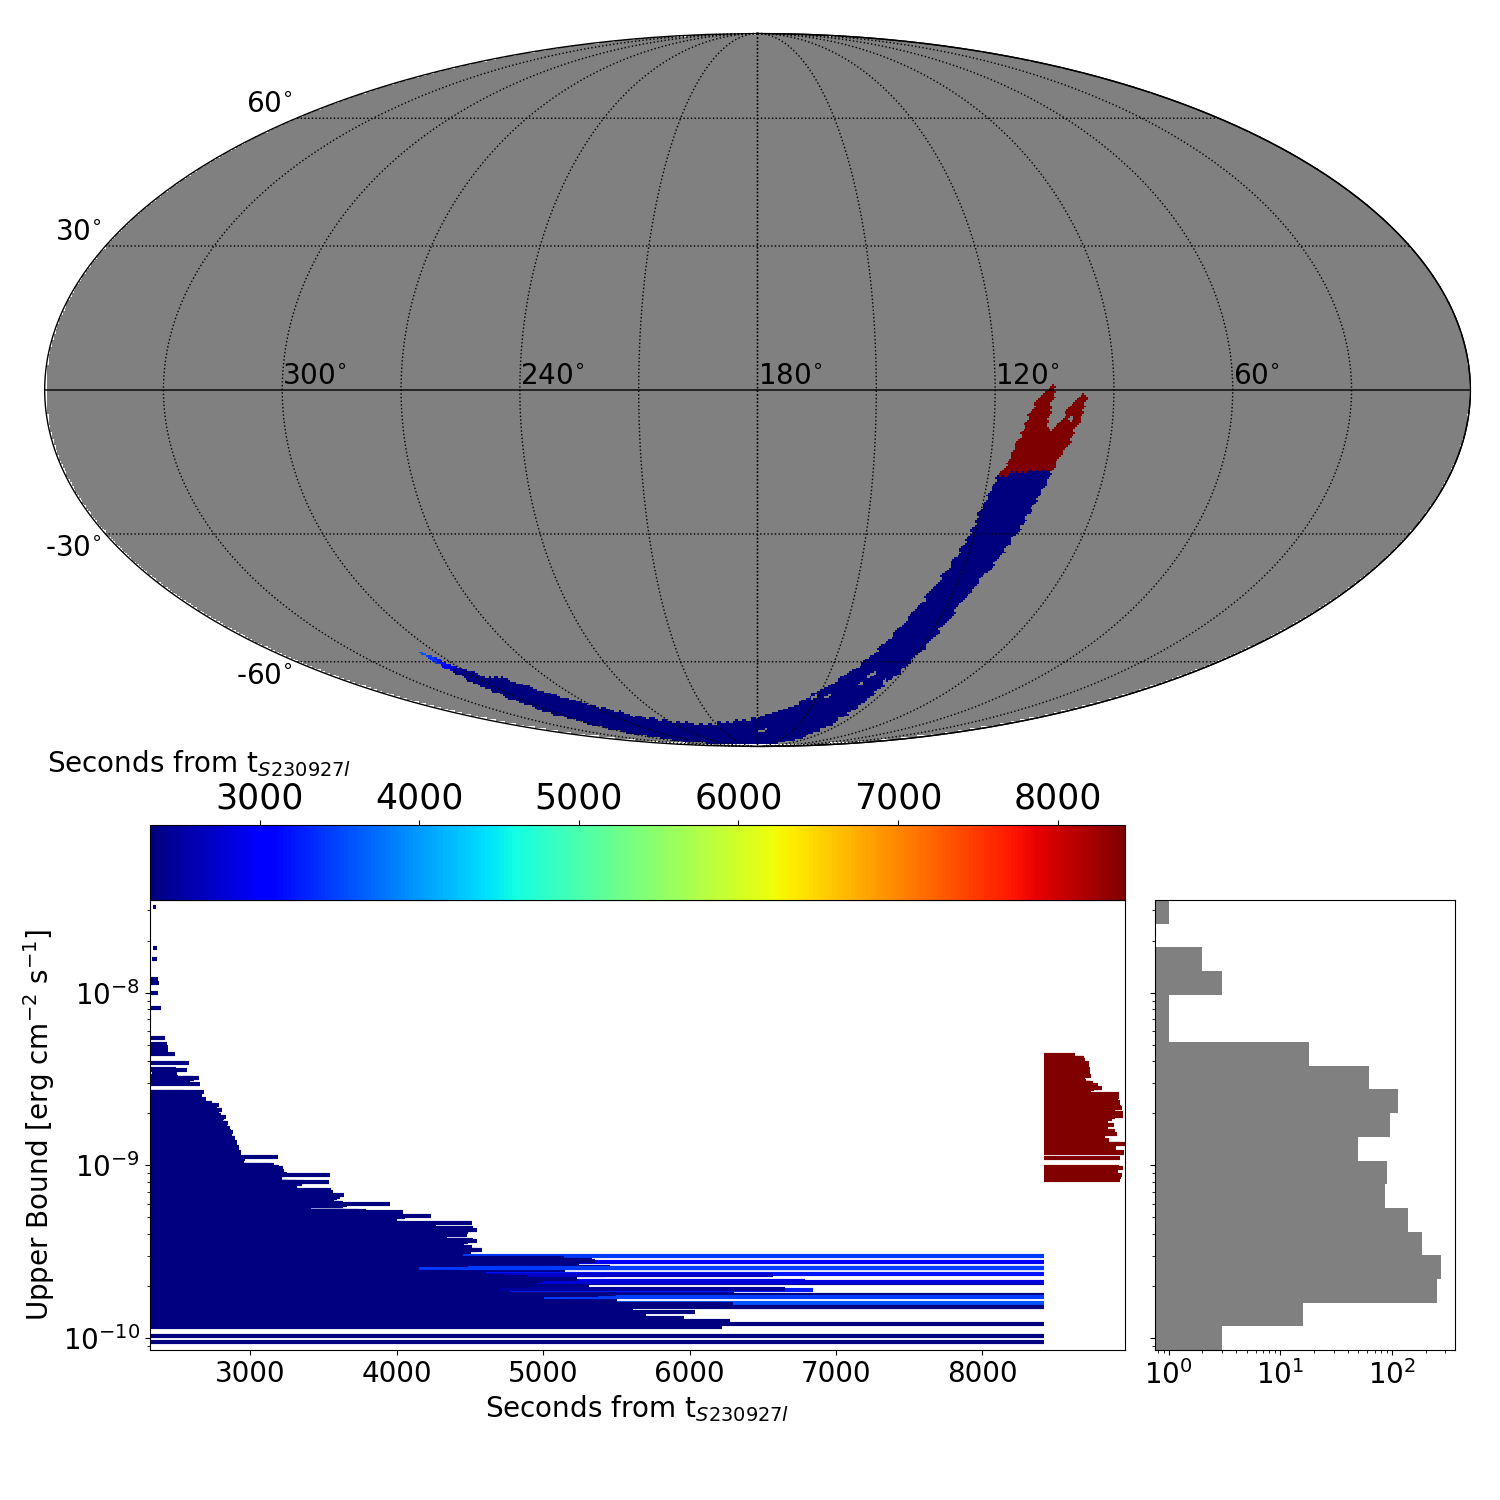
| ADAPTIVE TIME INTERVAL ANALYSIS |
|
|
|
DISTRIBUTION OF THE UPPER BOUNDS |
|
|
| TS MAXIMUM |
|---|
|
TS = 25.5 |
Ra | 305.53° |
| Dec | -76.08° |
| Nearby 4FGL sources | 0 |
| Sun in this pixel? | False |
| Moon in this pixel? | False |
| LIST OF OTHER TS > 25.0 |
|---|
|
|
TS MAP |
|
|
| FLUX UB EXTREMES |
| UB min | 0.94 e-10 erg cm-2 s-1 |
| UB max | 31.3 e-9 erg cm-2 s-1 |
|
|
UL MAP |
|
|
|
|
|
|
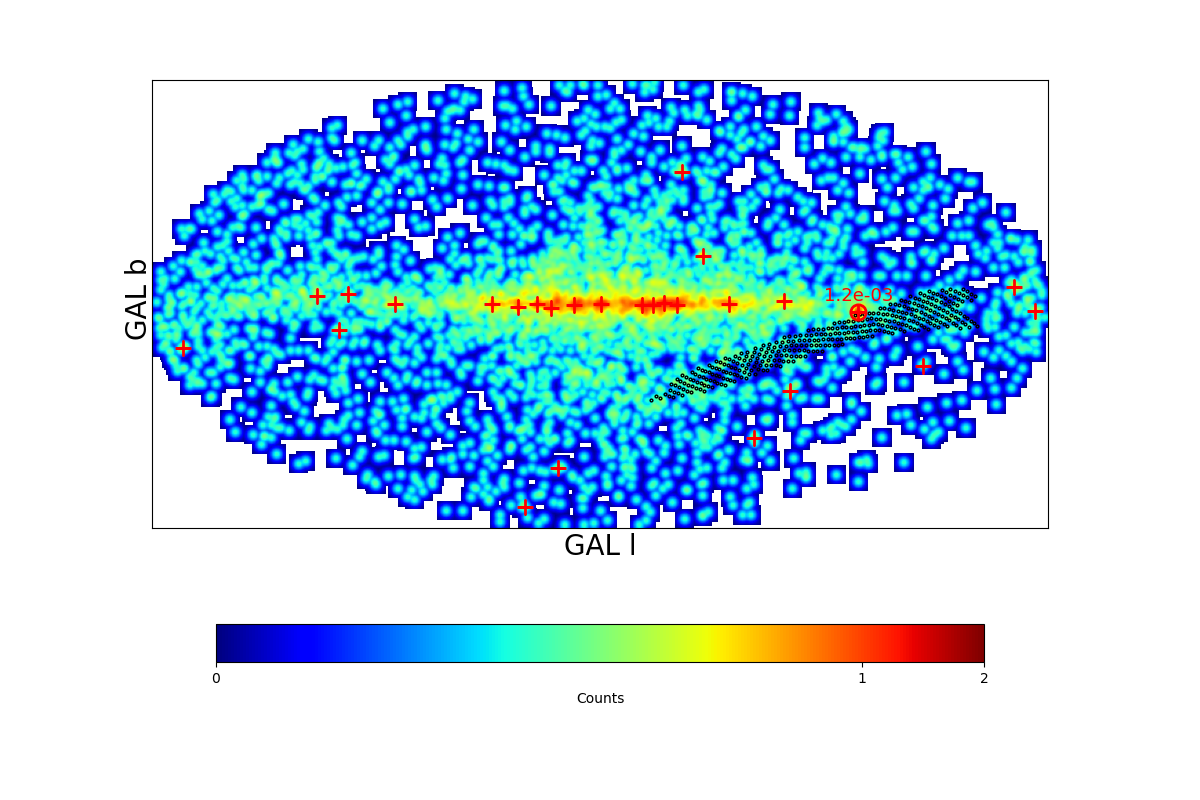
COUNT MAP |
|
|
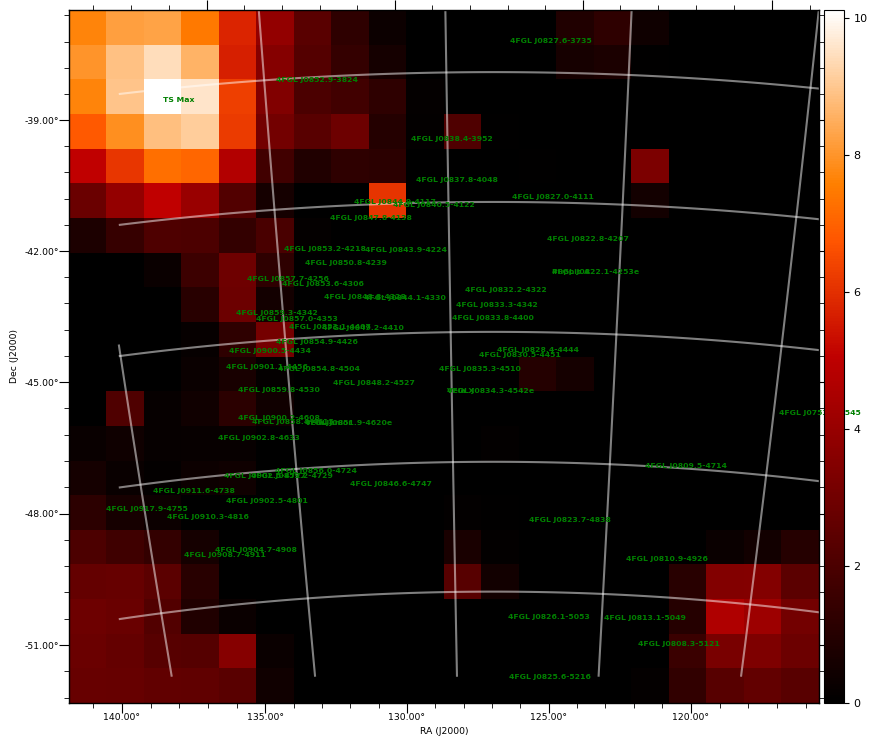
| TS MAXIMUM |
|---|
|
TS = 10.1 |
Ra | 136.38° |
| Dec | -38.68° |
| Nearby 4FGL sources | 0 |
| Sun in this pixel? | False |
| Moon in this pixel? | False |
|
|
TS MAP |
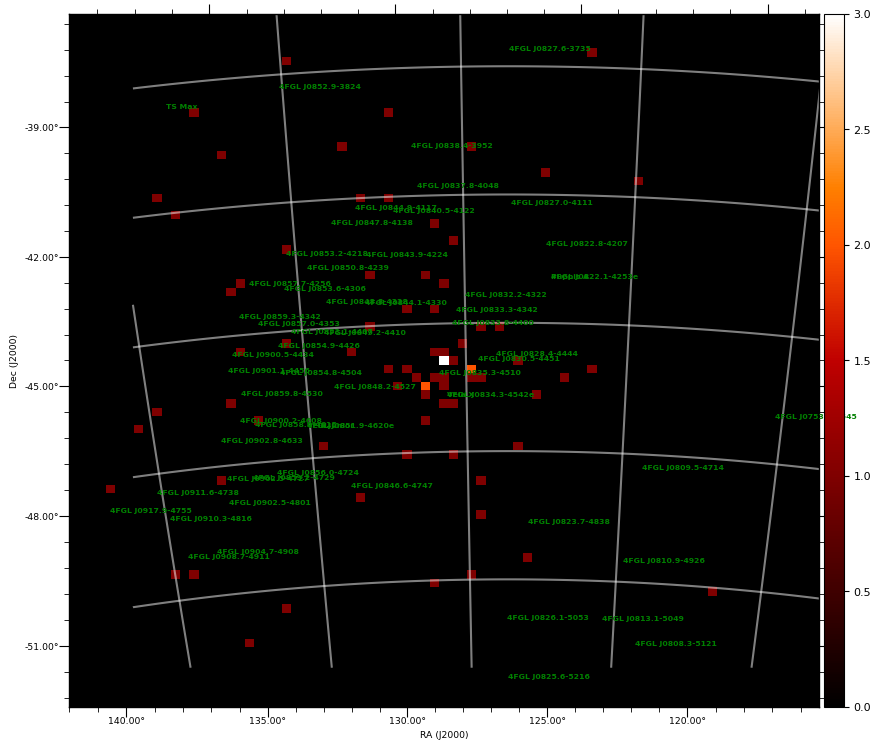
COUNT MAP |
|
|
|
|
|