| GWFUP ANALYSIS REPORT FOR GW S230831e |
|
|
|
| SUMMARY | |
| Name | S230831e |
| Trigger MET | 715139659.06 |
| Date | 2023-08-31 |
| Time | 01:54:14 |
| In SAA? | True |
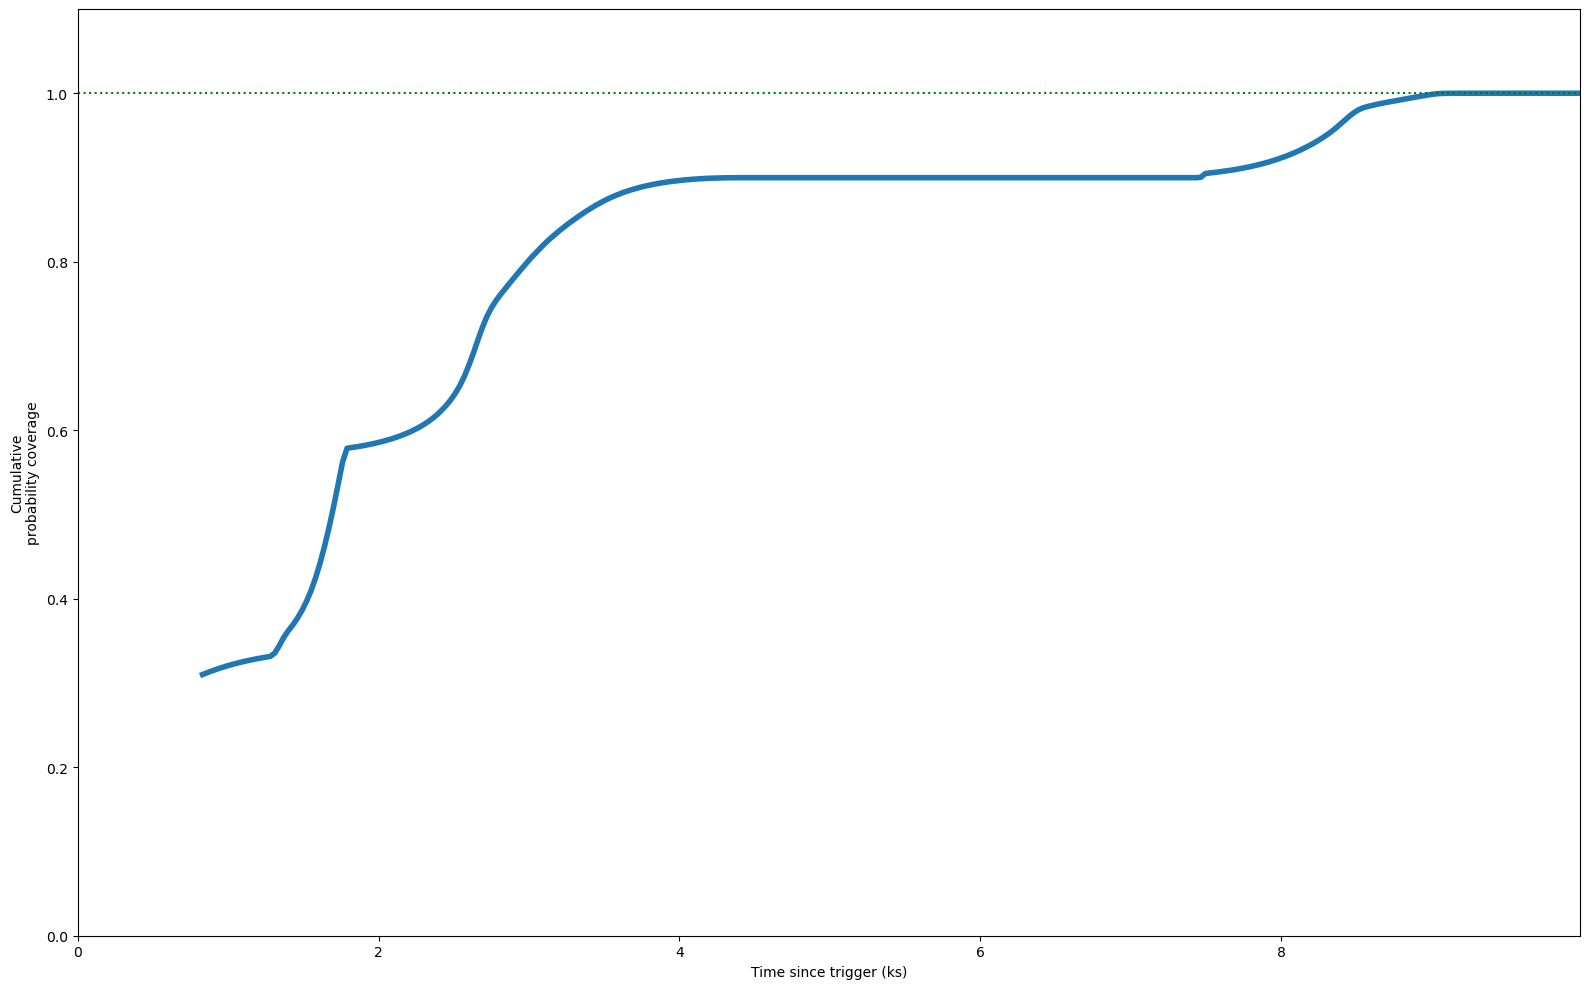
| Inst Coverage | 31.0% (0.8 ks) |
| T Max Coverage | 9.3 ks (100.0%) |
| E Min | 100.0 MeV |
| E Max | 100000.0 MeV |
| T Start | 0.0 s |
| T Stop | 10000.0 s |
| Theta Max | 65.0° |
| Z Max | 100.0° |
| ROI | 8.0° |
| IRF | p8_source |
| Galactic Model | template |
| Strategy | time |
| Particle Model | isotr template |
| NSide | 64 |
| Version | v02 |
|
| COVERAGE |
|
|
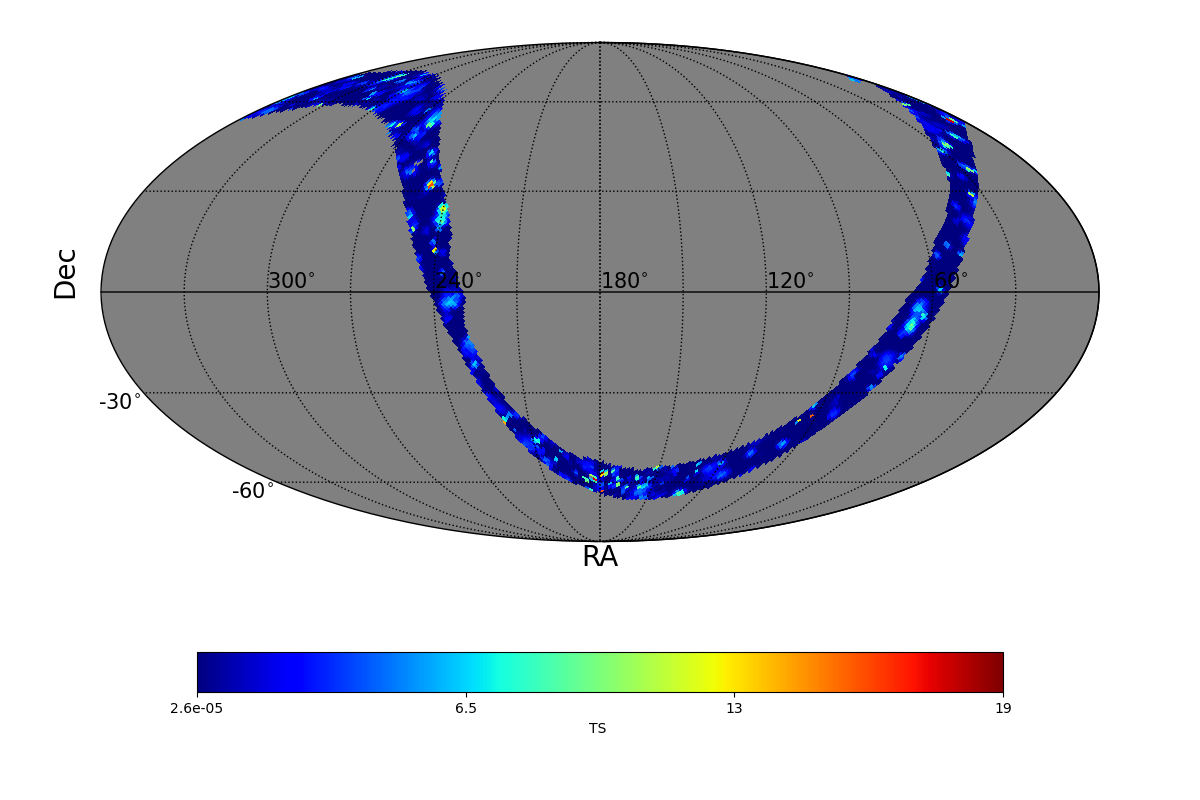
| FIXED TIME INTERVAL ANALYSIS |
|
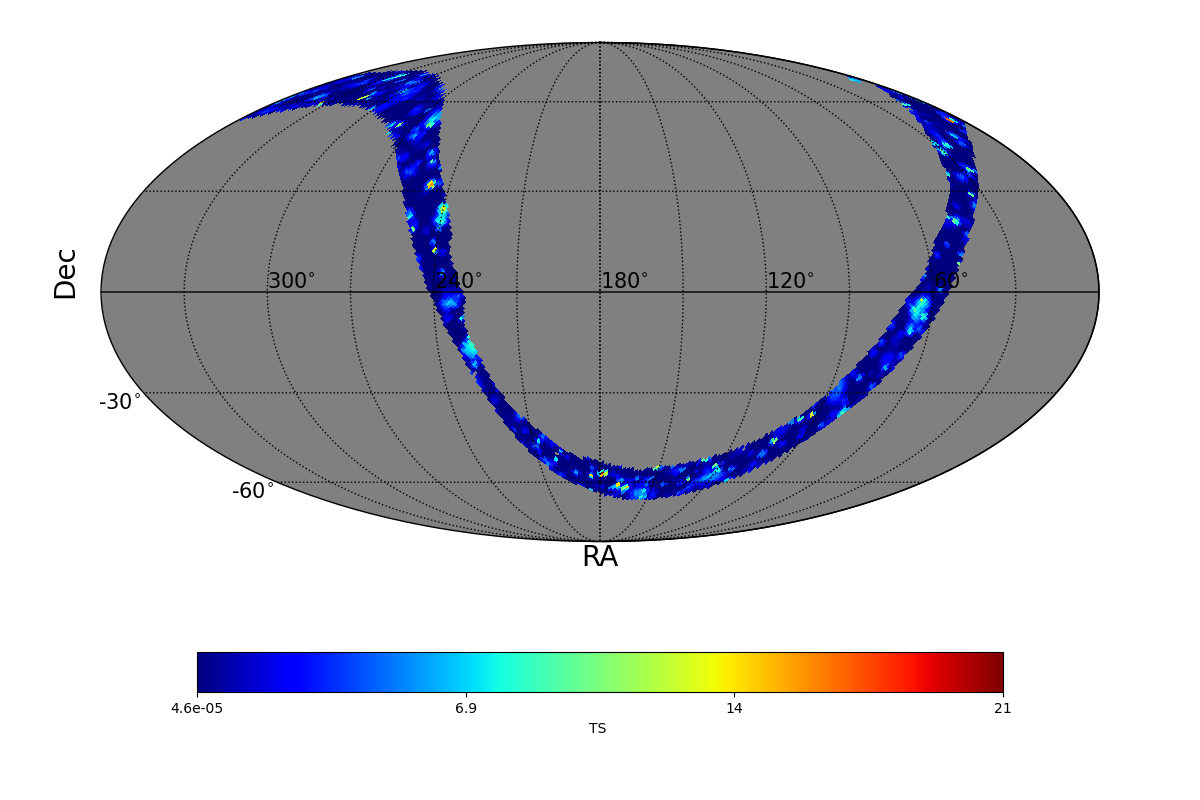
| TS MAXIMUM |
|---|
|
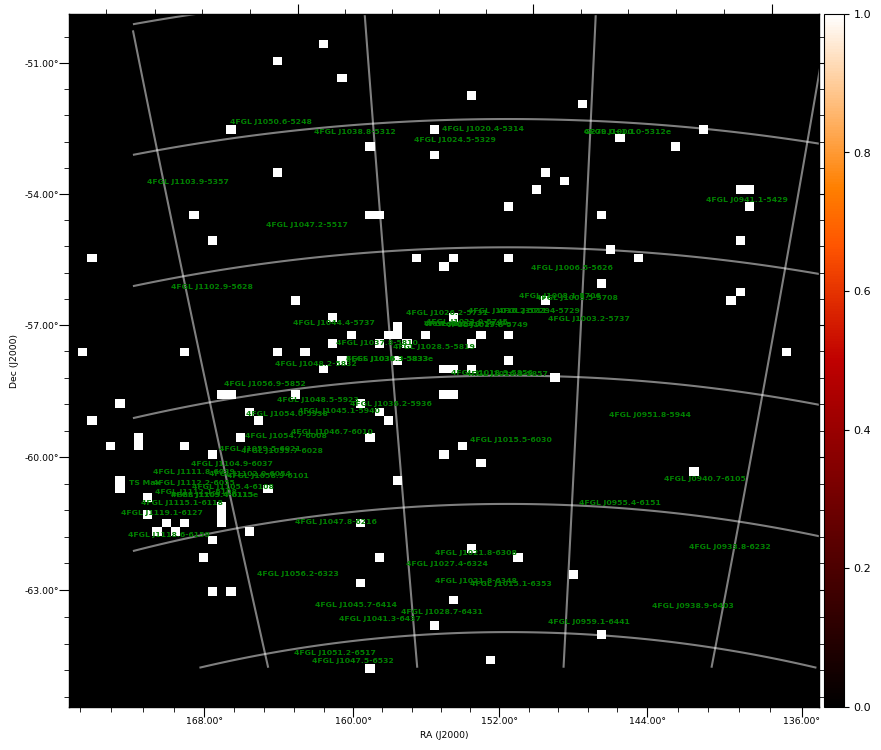
TS = 20.8 |
Ra | 179.0° |
| Dec | -56.64° |
| Nearby 4FGL sources | 0 |
| Sun in this pixel? | False |
| Moon in this pixel? | False |
| LIST OF OTHER TS > 25.0 |
|---|
|
| TS MAP |
|
|
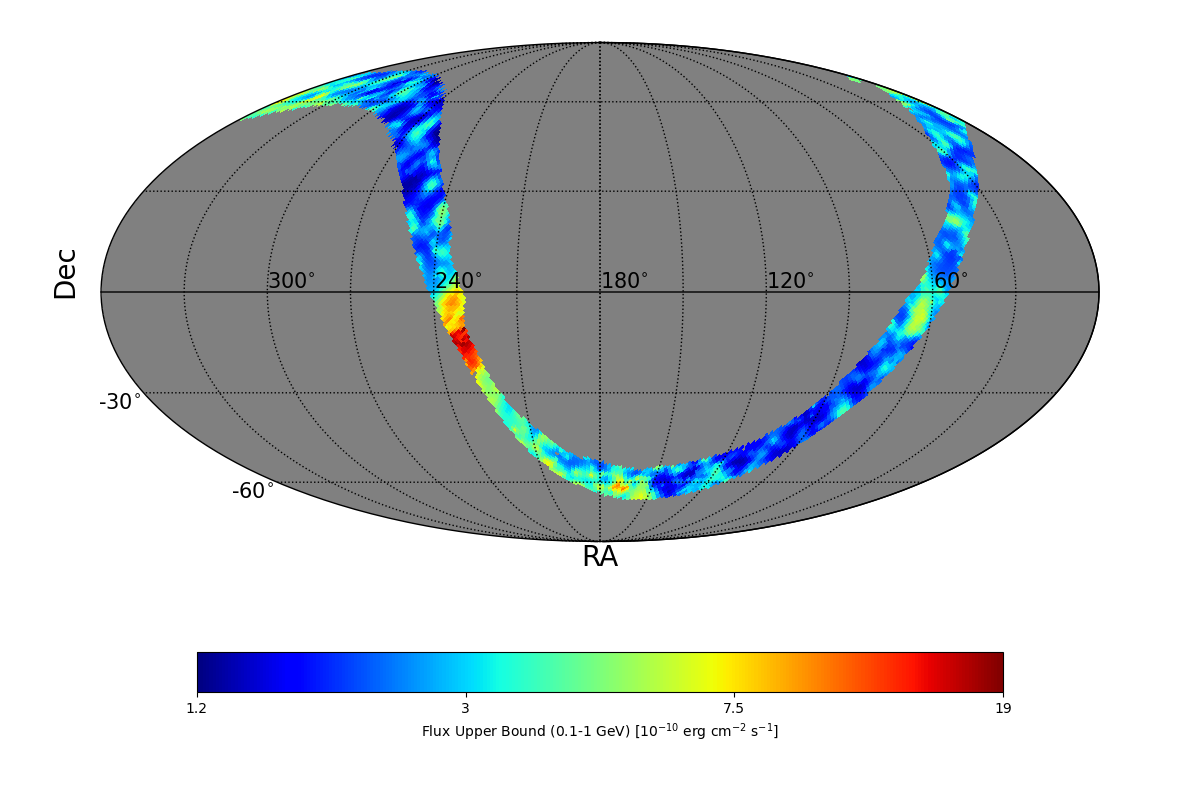
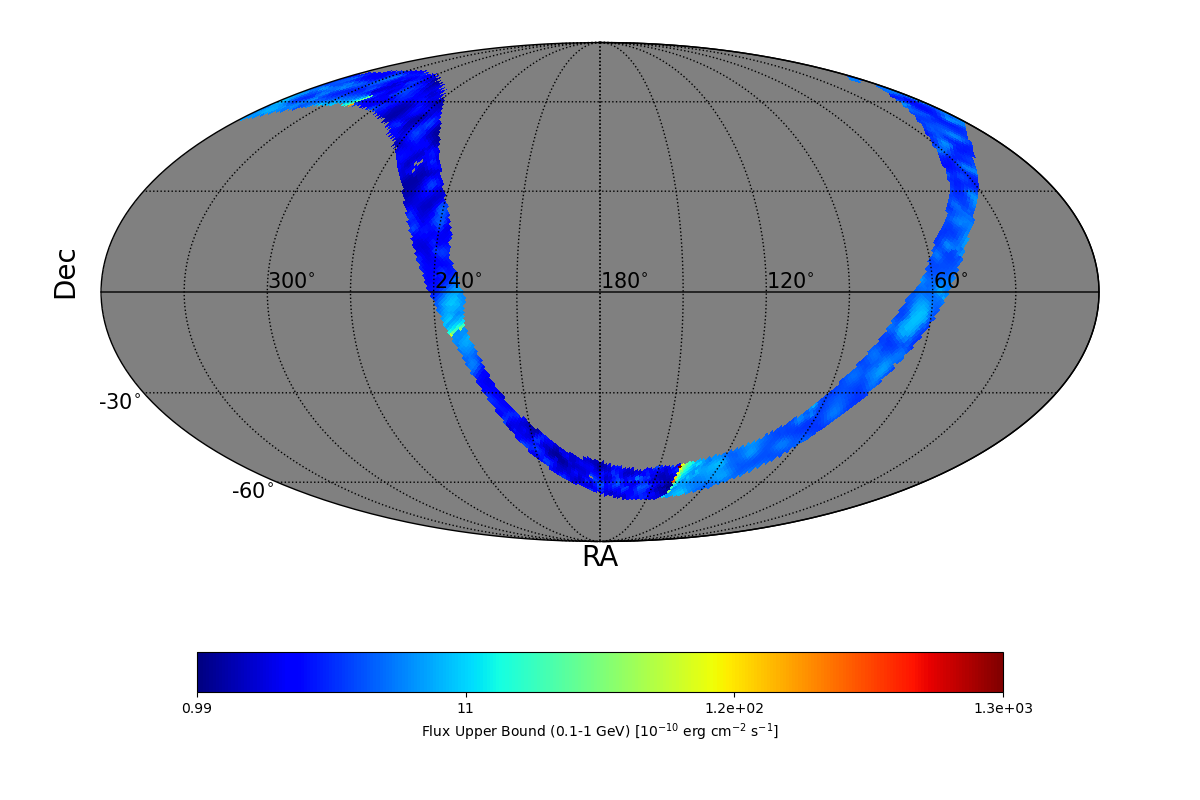
| FLUX UB EXTREMES |
| UB min | 1.17 e-10 erg cm-2 s-1 |
| UB max | 1.9 e-9 erg cm-2 s-1 |
| BAYESIAN FLUX UB (CL=95%) |
| Photon flux | 11.92 e-7 ph cm-2 s-1 |
| Energy flux | 5.87 e-10 erg cm-2 s-1 |
|
| UL MAP |
|
|
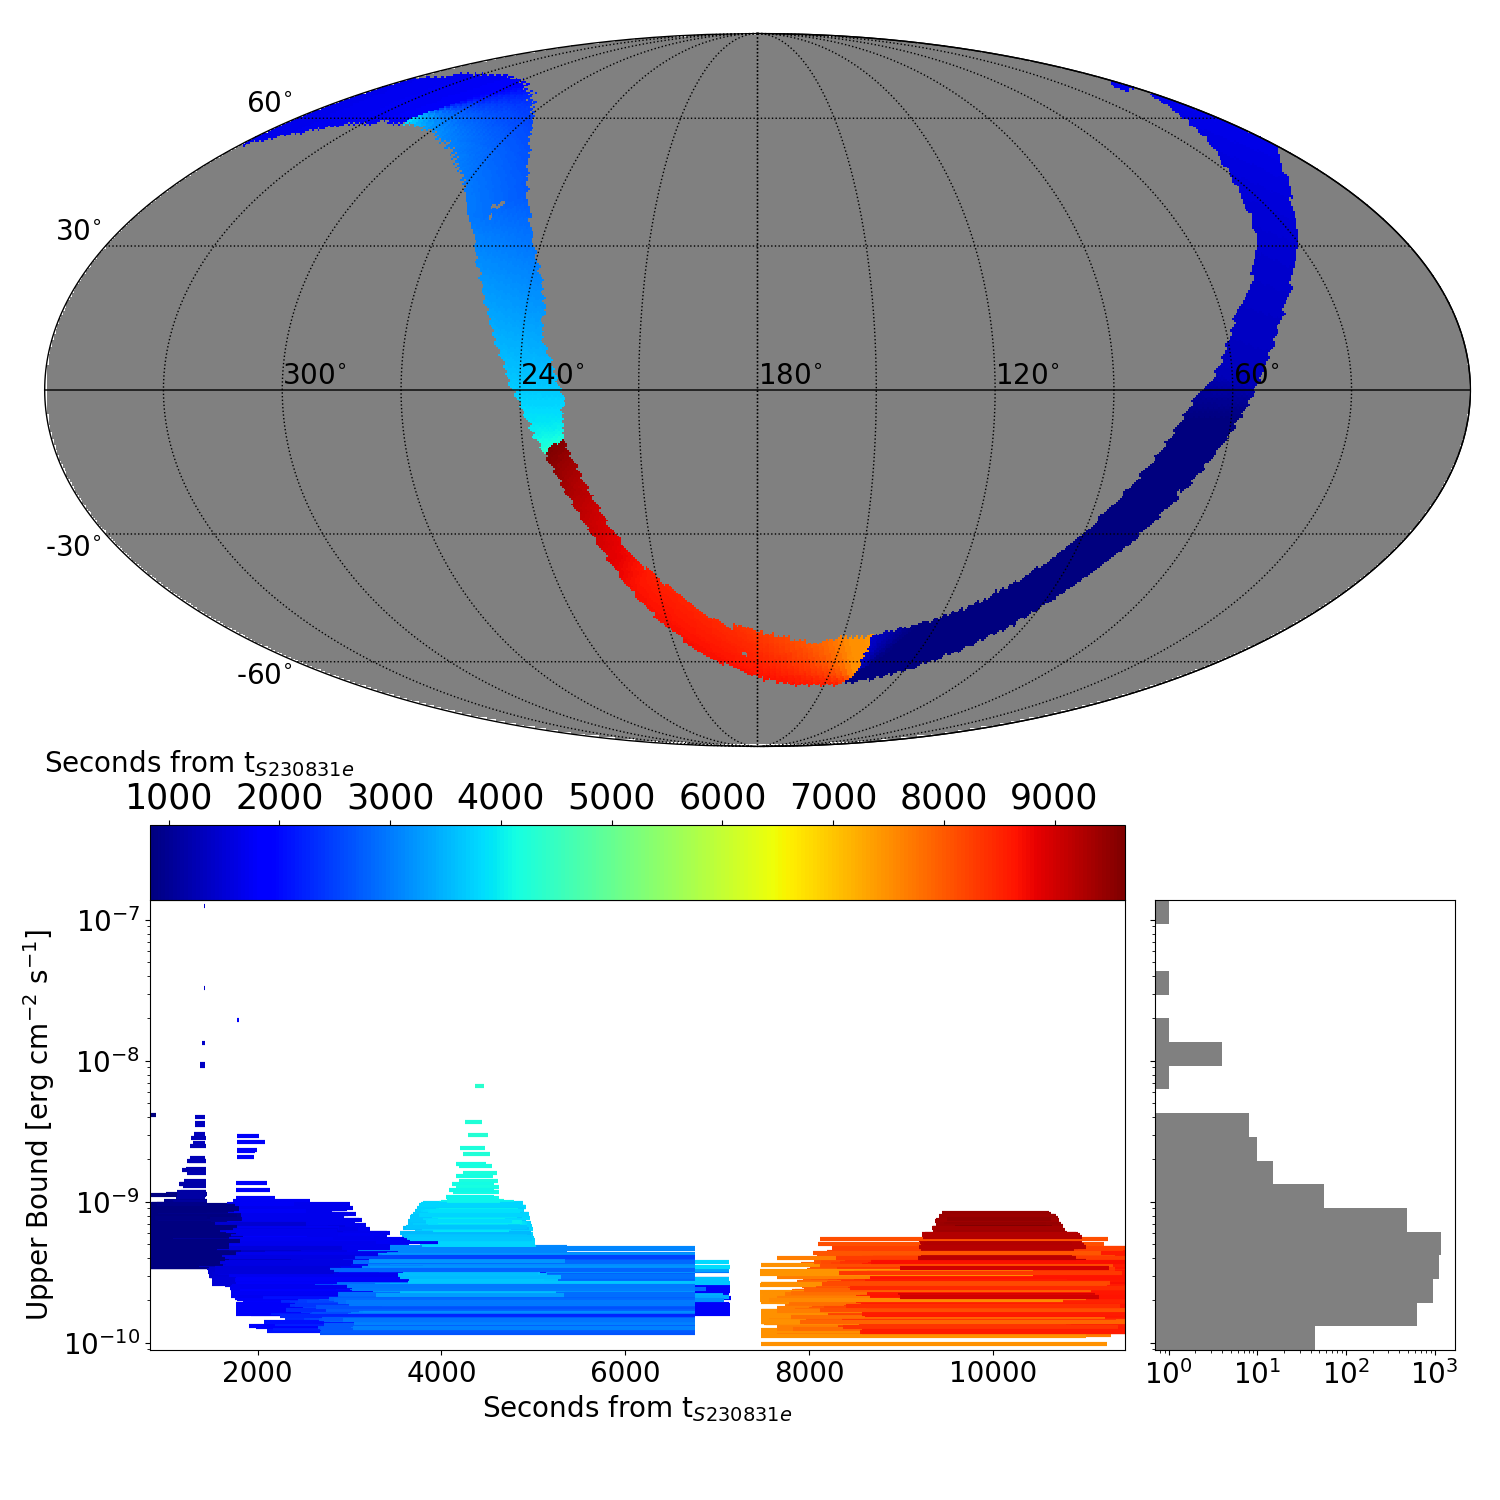
| ADAPTIVE TIME INTERVAL ANALYSIS |
|
|
|
DISTRIBUTION OF THE UPPER BOUNDS |
|
|
| TS MAXIMUM |
|---|
|
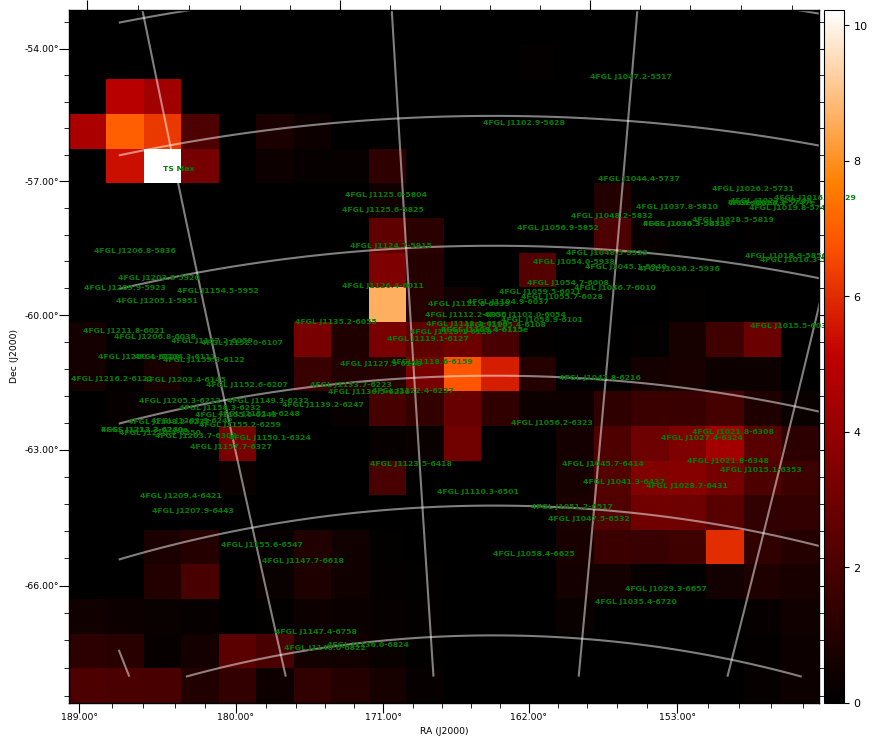
TS = 19.5 |
Ra | 179.0° |
| Dec | -56.64° |
| Nearby 4FGL sources | 0 |
| Sun in this pixel? | False |
| Moon in this pixel? | False |
| LIST OF OTHER TS > 25.0 |
|---|
|
|
TS MAP |
|
|
| FLUX UB EXTREMES |
| UB min | 0.99 e-10 erg cm-2 s-1 |
| UB max | 126.0 e-9 erg cm-2 s-1 |
|
|
UL MAP |
|
|
|
|
|
|
COUNT MAP |

|
|
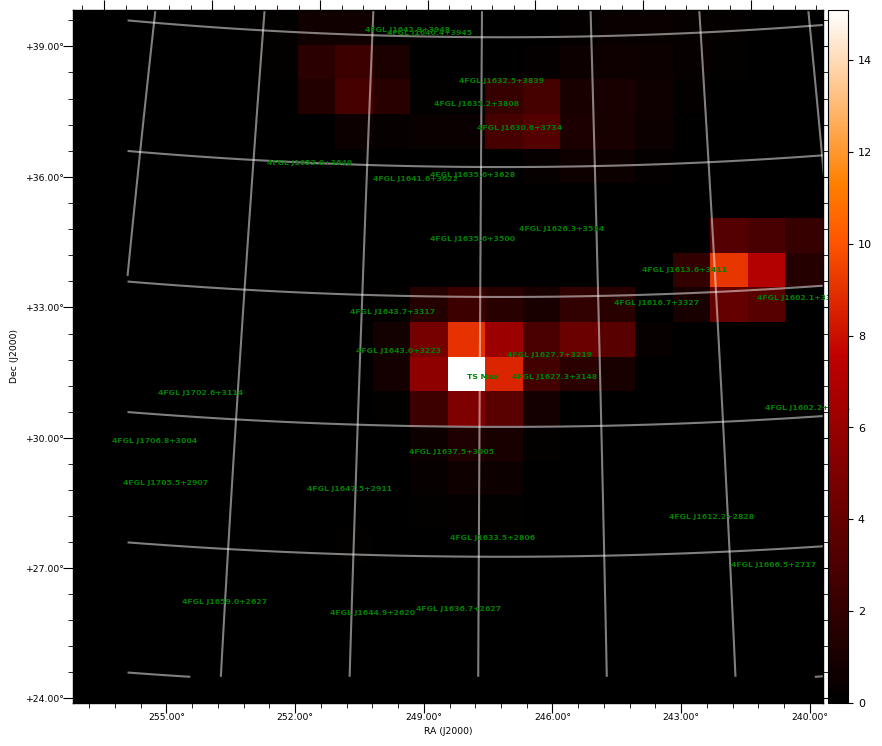
| TS MAXIMUM |
|---|
|
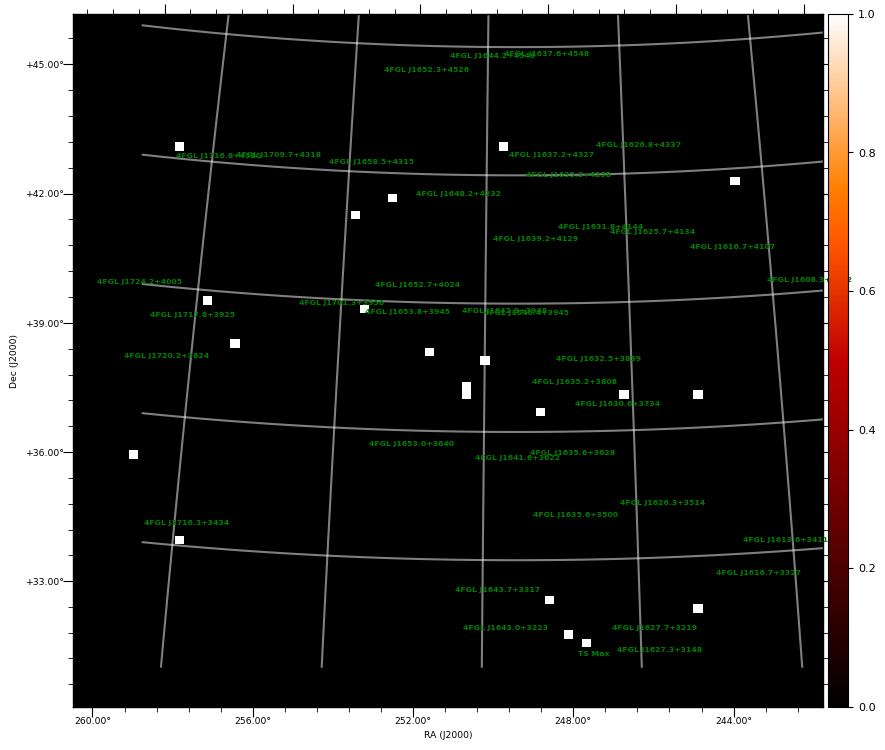
TS = 15.1 |
Ra | 247.96° |
| Dec | 31.83° |
| Nearby 4FGL sources | 2 |
| 4FGL J1627.3+3148 | Δ=0.96° |
| 4FGL J1627.7+3219 | Δ=0.99° |
| Sun in this pixel? | False |
| Moon in this pixel? | False |
|
|
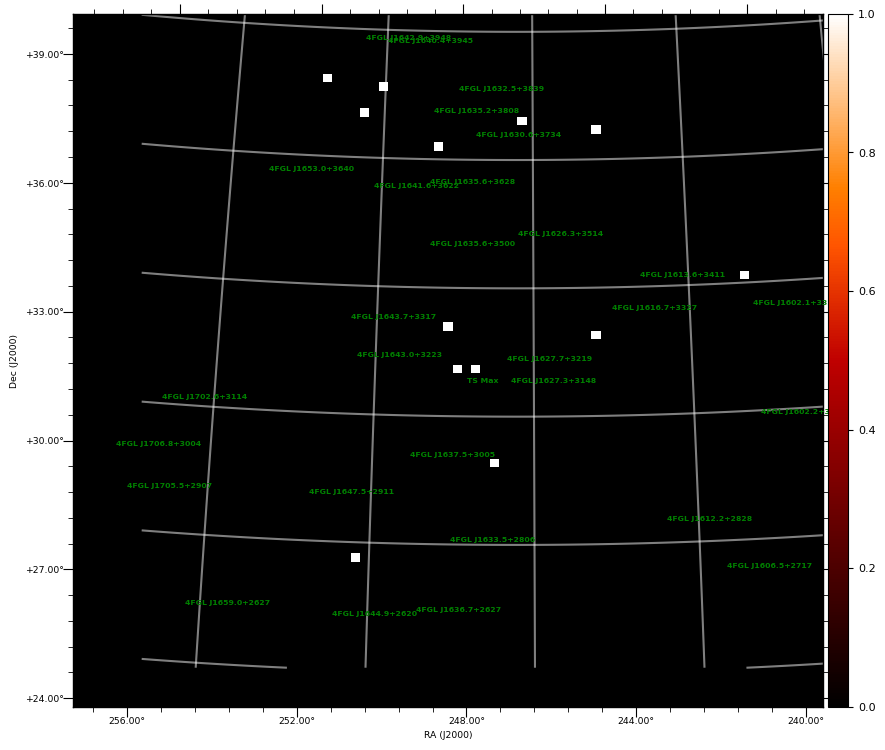
TS MAP |
COUNT MAP |
|
|
|
| TS MAXIMUM |
|---|
|
TS = 10.2 |
Ra | 169.09° |
| Dec | -60.81° |
| Nearby 4FGL sources | 7 |
| 4FGL J1109.4-6115e | Δ=0.95° |
| 4FGL J1111.8-6039 | Δ=0.57° |
| 4FGL J1112.1-6108 | Δ=0.61° |
| 4FGL J1112.2-6055 | Δ=0.51° |
| 4FGL J1115.1-6118 | Δ=0.52° |
| 4FGL J1119.1-6127 | Δ=0.73° |
| FGES J1109.4-6115 | Δ=0.95° |
| Sun in this pixel? | False |
| Moon in this pixel? | False |
|
|
TS MAP |
COUNT MAP |

|
|
|
| TS MAXIMUM |
|---|
|
TS = 10.2 |
Ra | 178.33° |
| Dec | -57.04° |
| Nearby 4FGL sources | 0 |
| Sun in this pixel? | False |
| Moon in this pixel? | False |
|
|
TS MAP |
COUNT MAP |
|

|
|
| TS MAXIMUM |
|---|
|
TS = 11.0 |
Ra | 247.84° |
| Dec | 31.74° |
| Nearby 4FGL sources | 2 |
| 4FGL J1627.3+3148 | Δ=0.86° |
| 4FGL J1627.7+3219 | Δ=0.96° |
| Sun in this pixel? | False |
| Moon in this pixel? | False |
|
|
TS MAP |
COUNT MAP |

|
|
|
|
|