| GWFUP ANALYSIS REPORT FOR GW S230825k |
|
|
|
| SUMMARY | |
| Name | S230825k |
| Trigger MET | 714629619.53 |
| Date | 2023-08-25 |
| Time | 04:13:34 |
| In SAA? | False |
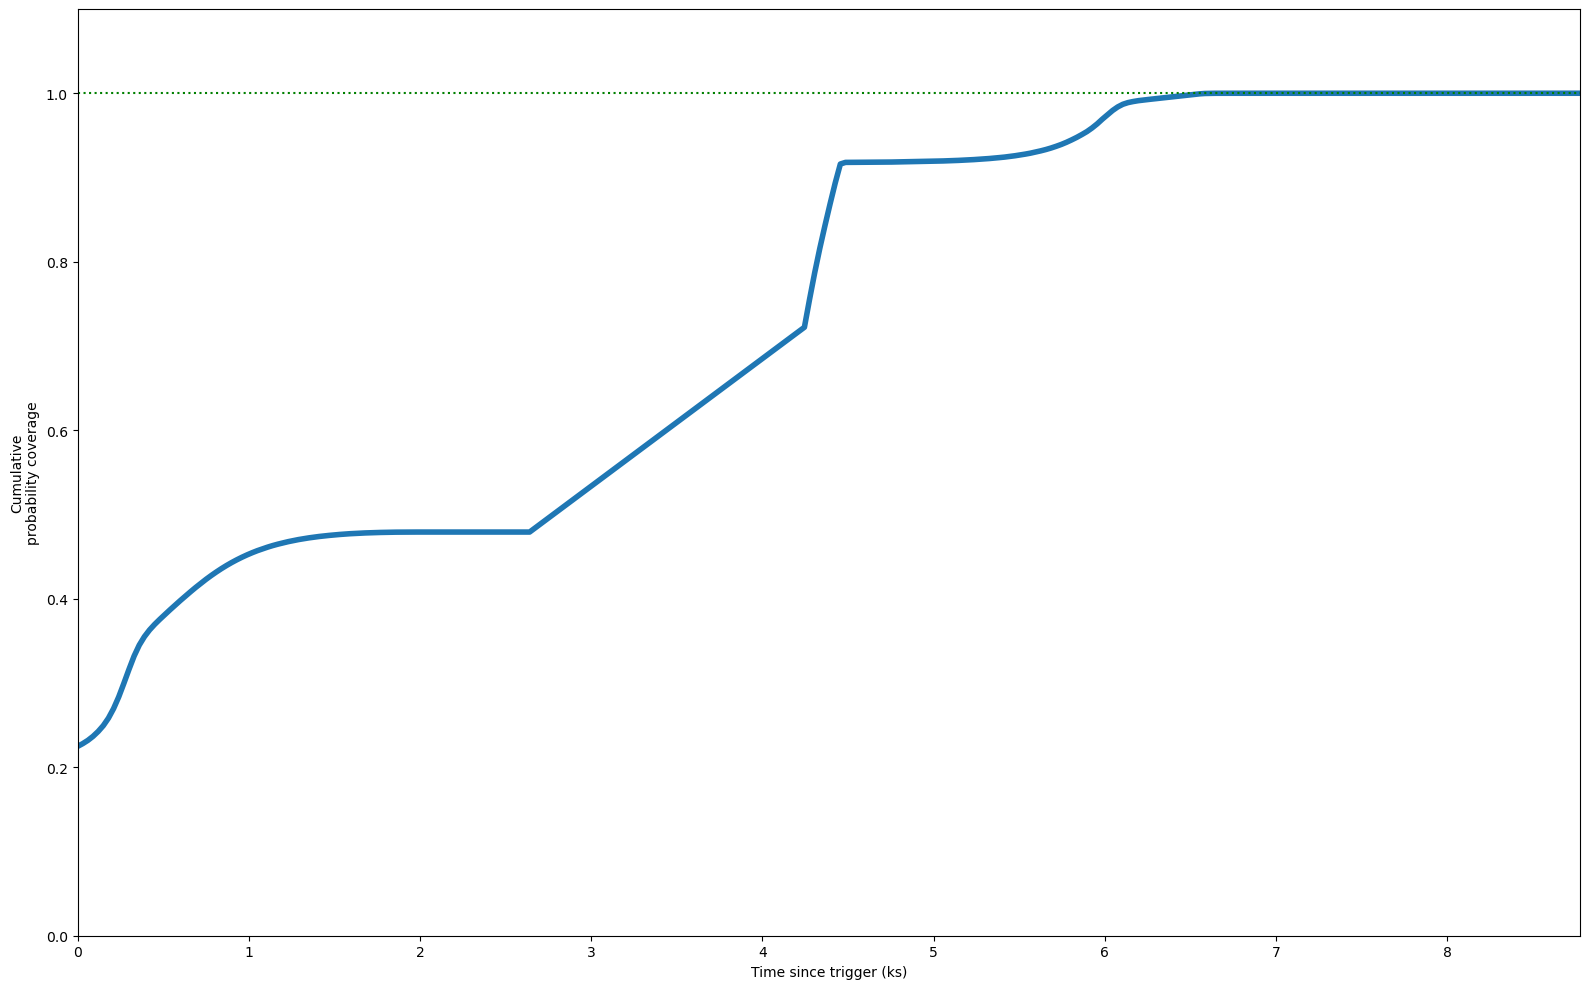
| Inst Coverage | 22.5% |
| T Max Coverage | 6.8 ks (100.0%) |
| E Min | 100.0 MeV |
| E Max | 100000.0 MeV |
| T Start | 0.0 s |
| T Stop | 10000.0 s |
| Theta Max | 65.0° |
| Z Max | 100.0° |
| ROI | 8.0° |
| IRF | p8_source |
| Galactic Model | template |
| Strategy | time |
| Particle Model | isotr template |
| NSide | 64 |
| Version | v02 |
|
| COVERAGE |
|
|
| FIXED TIME INTERVAL ANALYSIS |
|
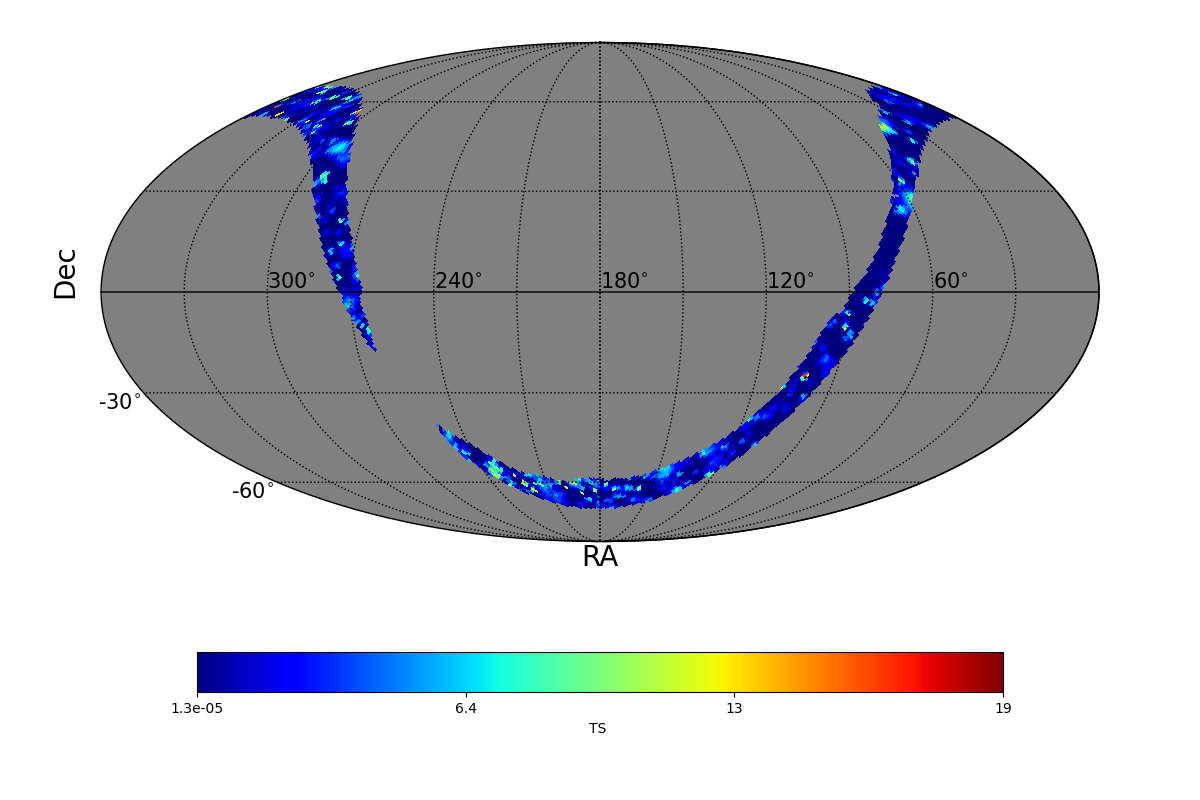
| TS MAXIMUM |
|---|
|
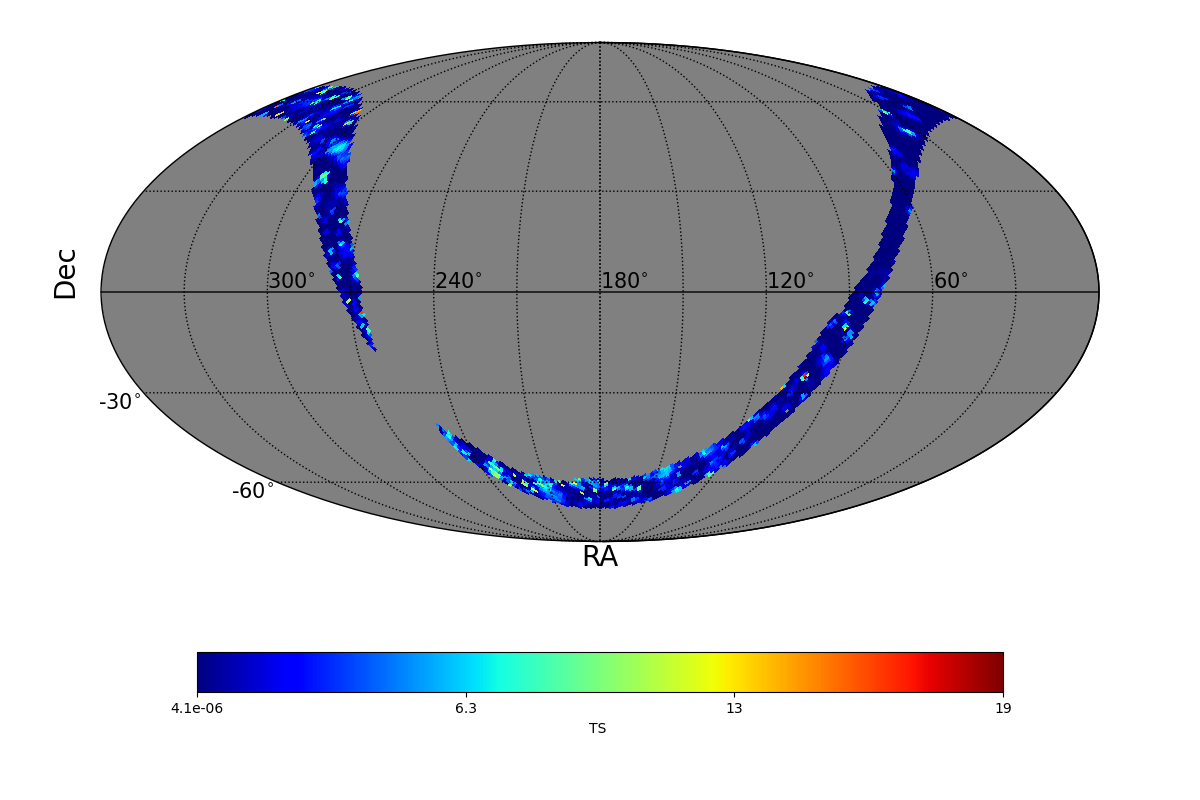
TS = 18.8 |
Ra | 101.25° |
| Dec | -25.28° |
| Nearby 4FGL sources | 0 |
| Sun in this pixel? | False |
| Moon in this pixel? | False |
| LIST OF OTHER TS > 25.0 |
|---|
|
| TS MAP |
|
|
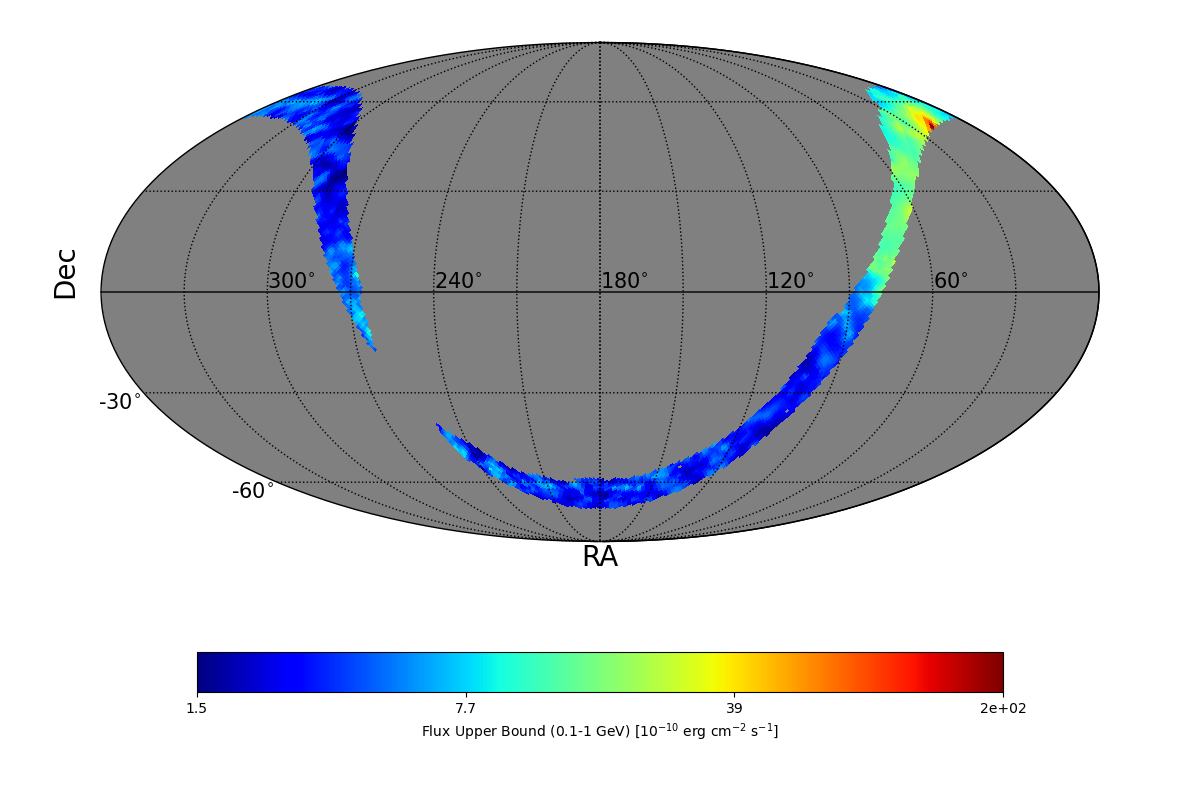
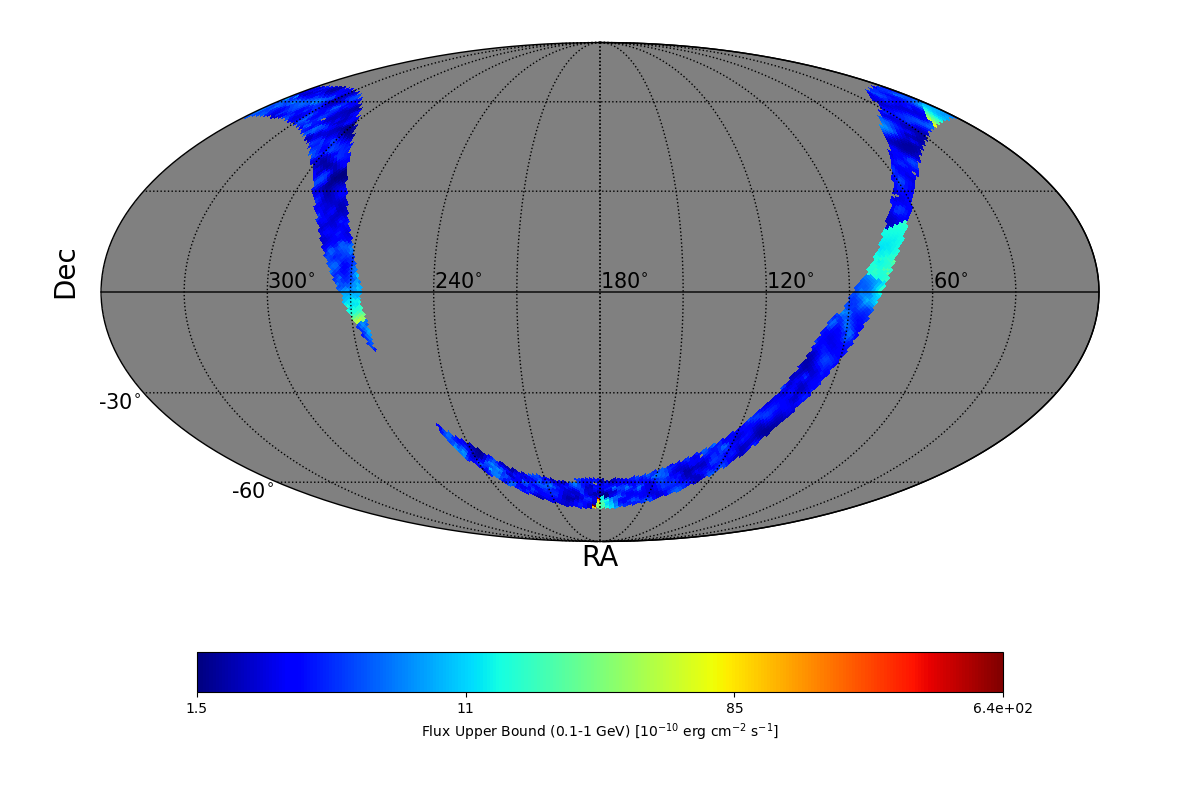
| FLUX UB EXTREMES |
| UB min | 1.51 e-10 erg cm-2 s-1 |
| UB max | 19.7 e-9 erg cm-2 s-1 |
| BAYESIAN FLUX UB (CL=95%) |
| Photon flux | 17.1 e-7 ph cm-2 s-1 |
| Energy flux | 8.1 e-10 erg cm-2 s-1 |
|
| UL MAP |
|
|
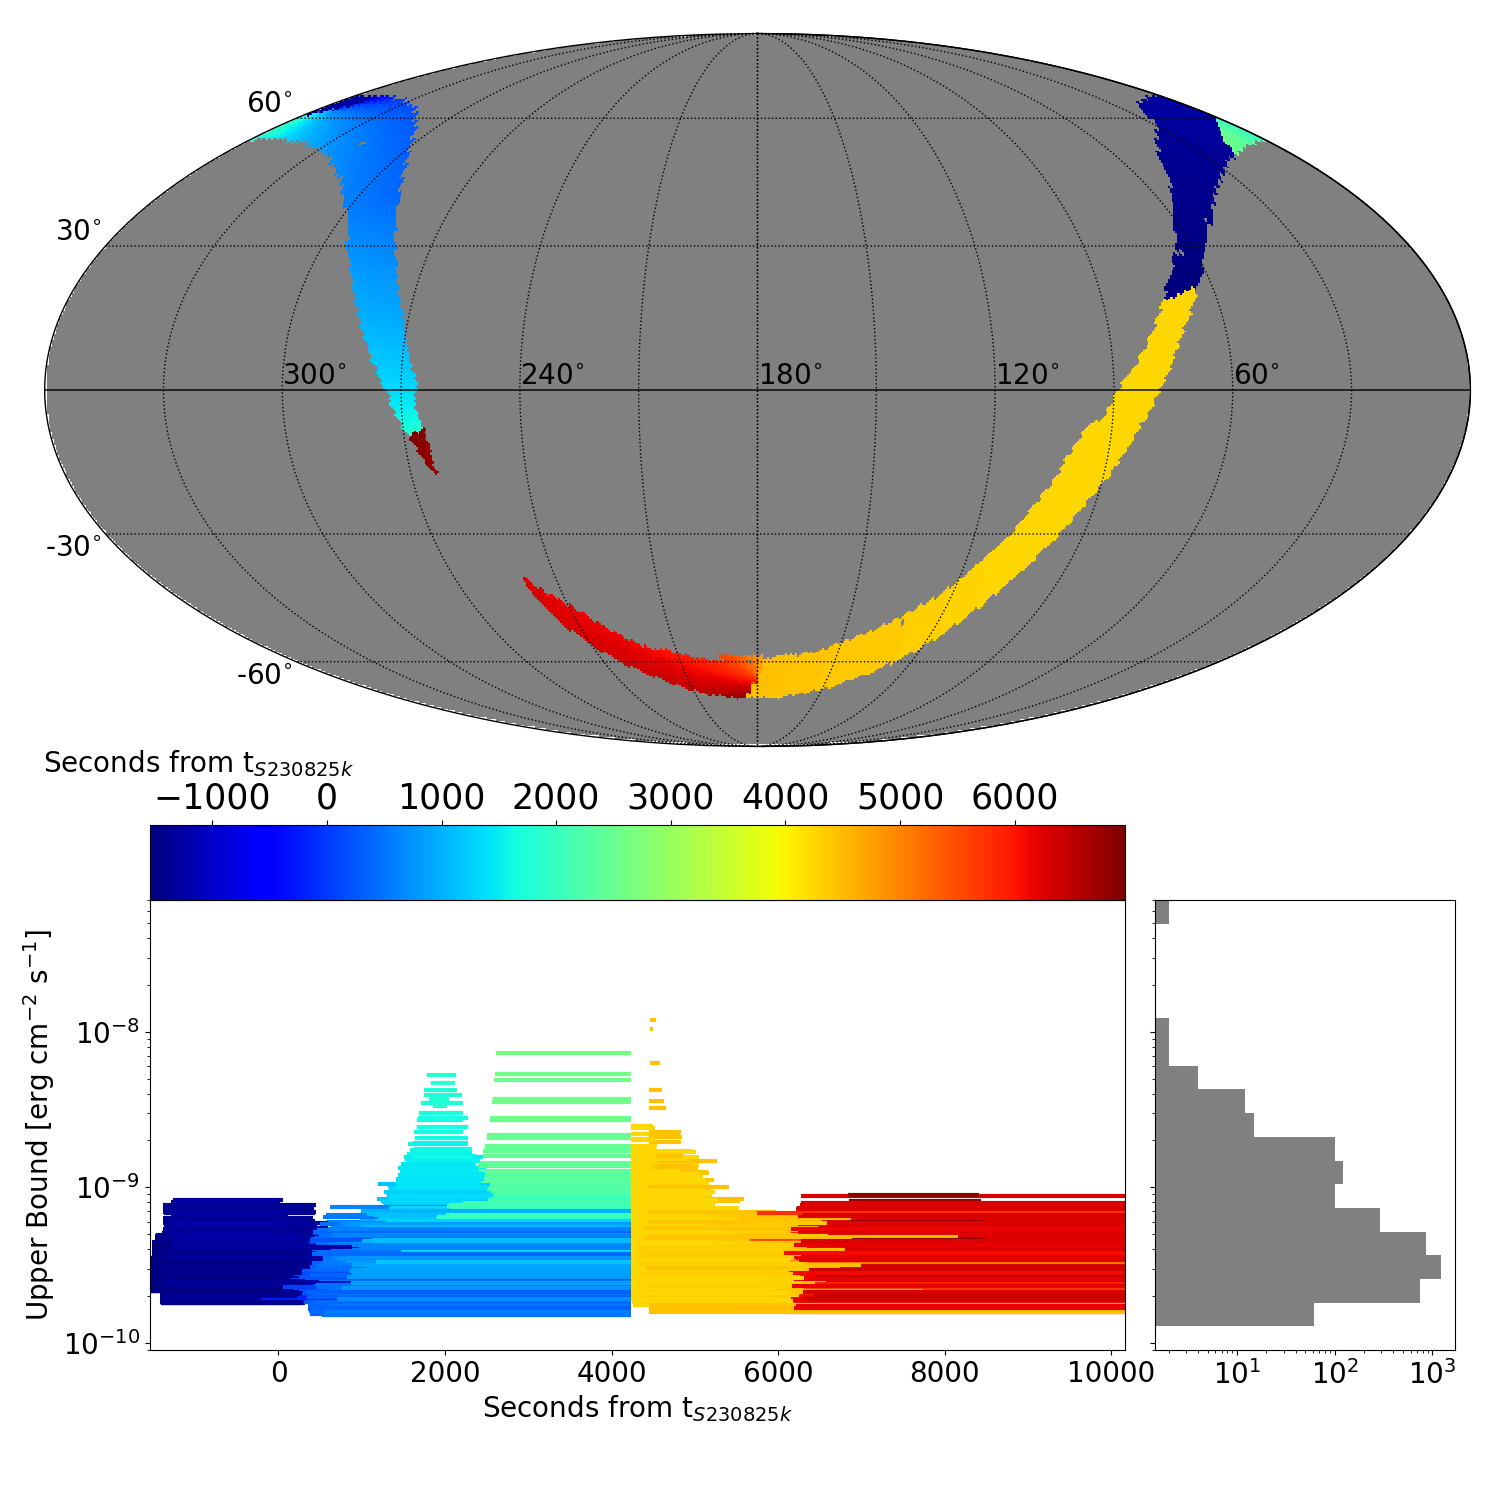
| ADAPTIVE TIME INTERVAL ANALYSIS |
|
|
|
DISTRIBUTION OF THE UPPER BOUNDS |
|
|
| TS MAXIMUM |
|---|
|
TS = 19.1 |
Ra | 101.25° |
| Dec | -25.28° |
| Nearby 4FGL sources | 0 |
| Sun in this pixel? | False |
| Moon in this pixel? | False |
| LIST OF OTHER TS > 25.0 |
|---|
|
|
TS MAP |
|
|
| FLUX UB EXTREMES |
| UB min | 1.5 e-10 erg cm-2 s-1 |
| UB max | 63.9 e-9 erg cm-2 s-1 |
|
|
UL MAP |
|
|
|
|
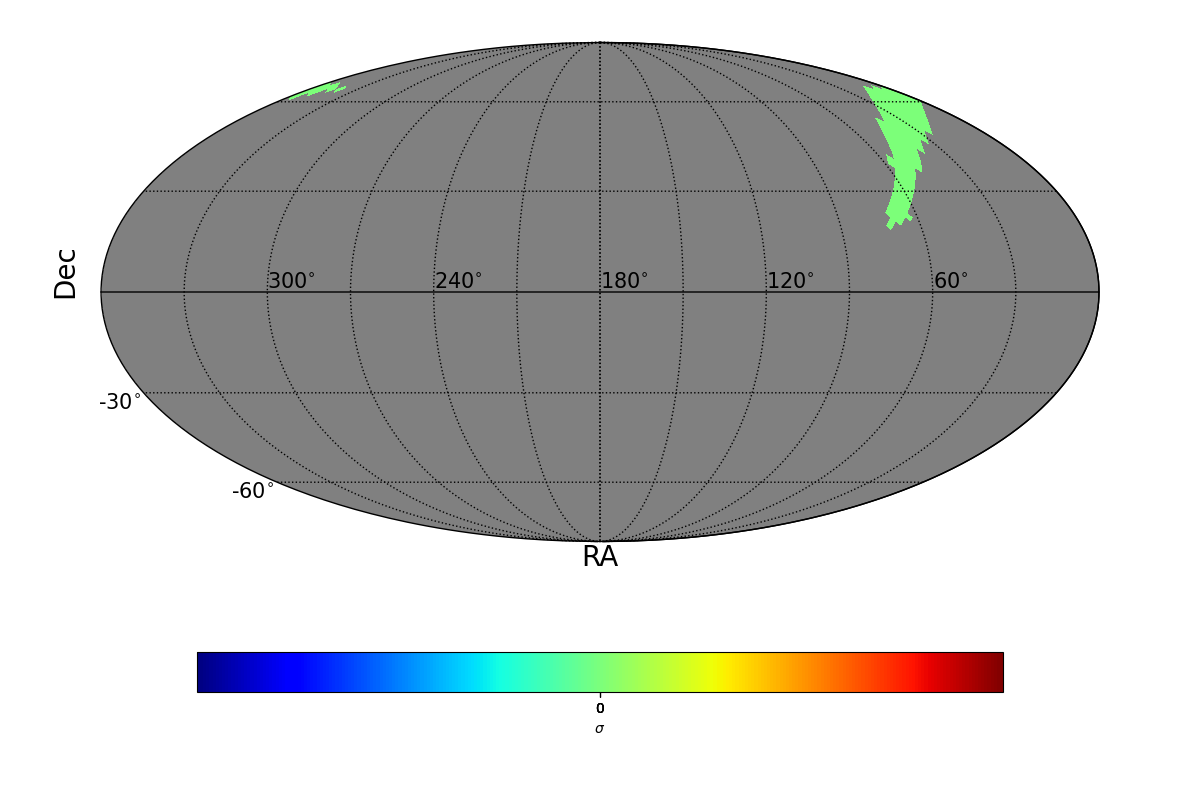
| SIGMA MAXIMUM |
|---|
|
SIGMA = 0.0 |
Ra | 351.56° |
| Dec | 66.44° |
| Nearby 4FGL sources | 0 |
| Sun in this pixel? | False |
| Moon in this pixel? | False |
| LIST OF OTHER SIGMA > 4 |
|---|
|
|
SIGMA MAP |
|
|
|
|
|
|
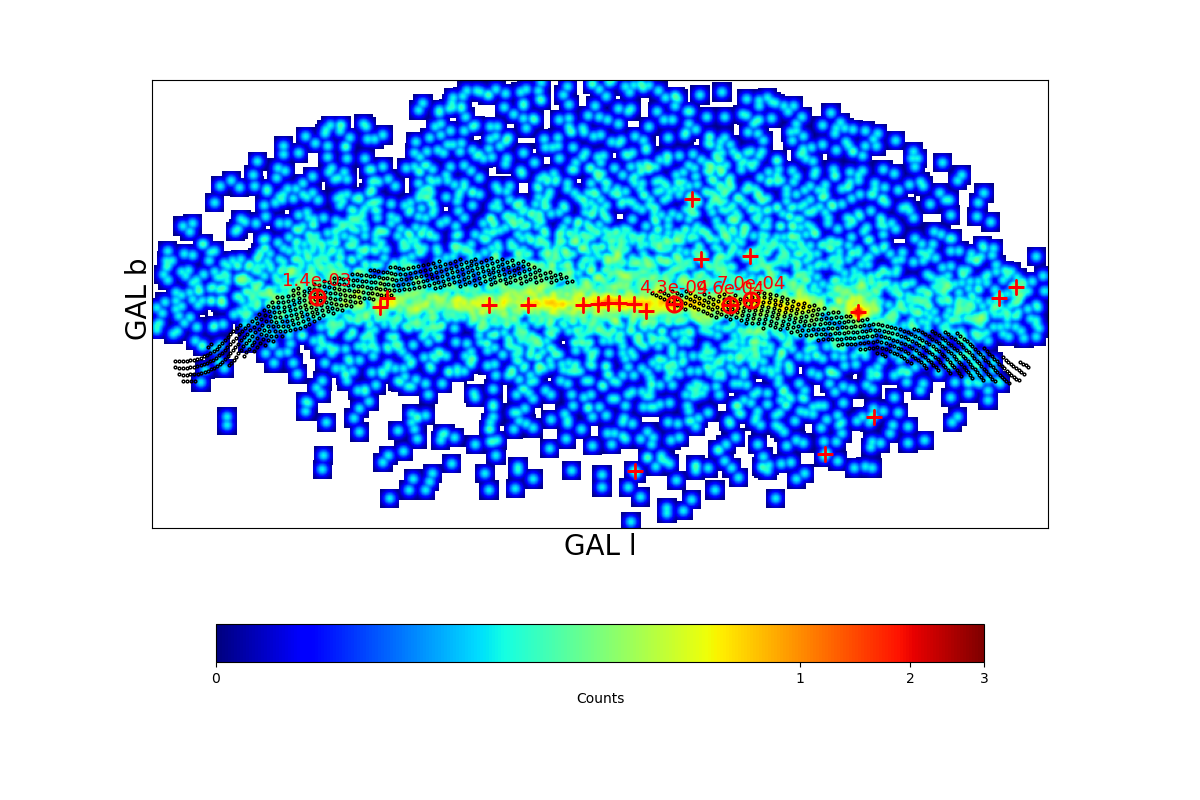
COUNT MAP |
|
|
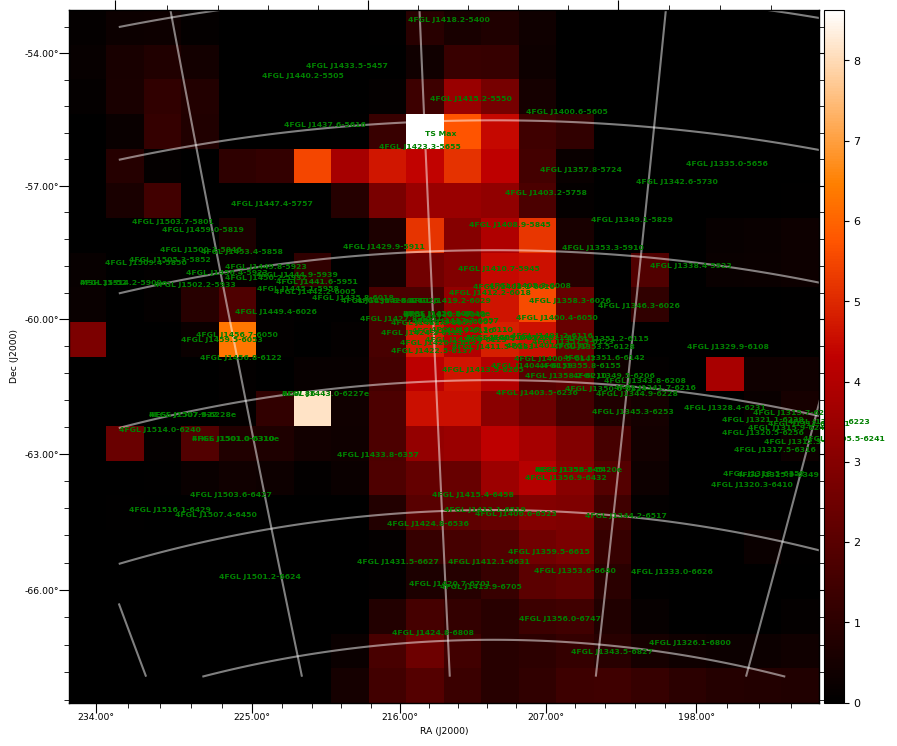
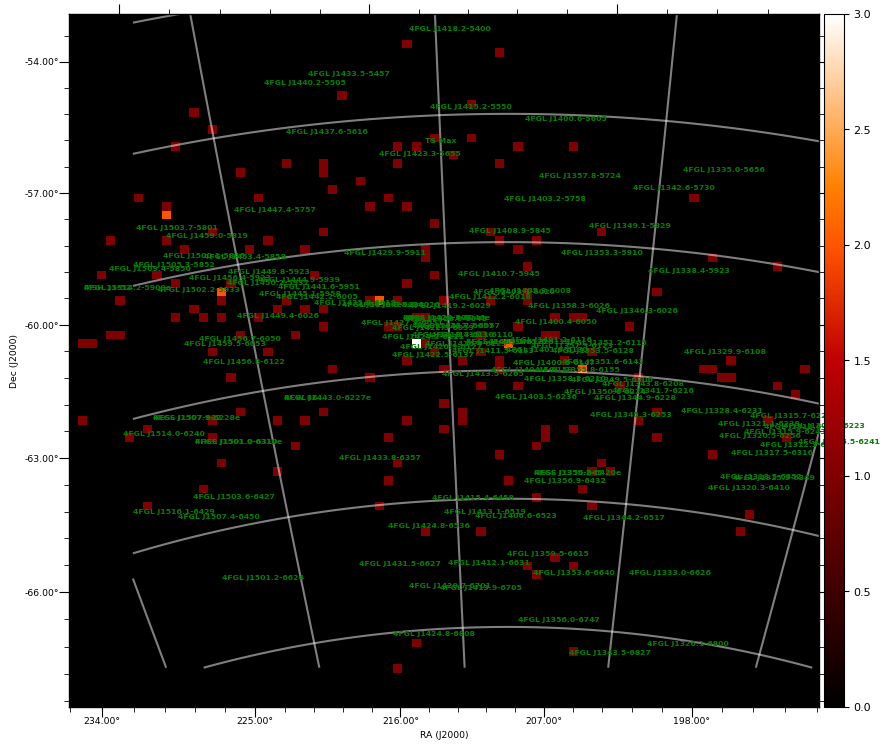
| TS MAXIMUM |
|---|
|
TS = 8.6 |
Ra | 214.01° |
| Dec | -56.64° |
| Nearby 4FGL sources | 1 |
| 4FGL J1415.2-5550 | Δ=0.81° |
| Sun in this pixel? | False |
| Moon in this pixel? | False |
|
|
TS MAP |
COUNT MAP |
|
|
|
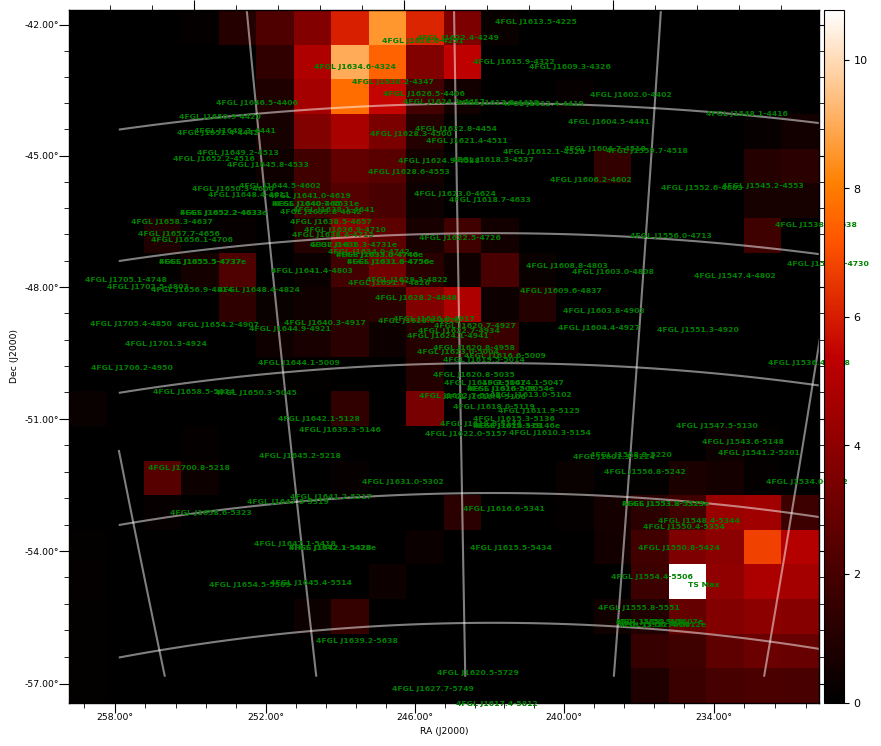
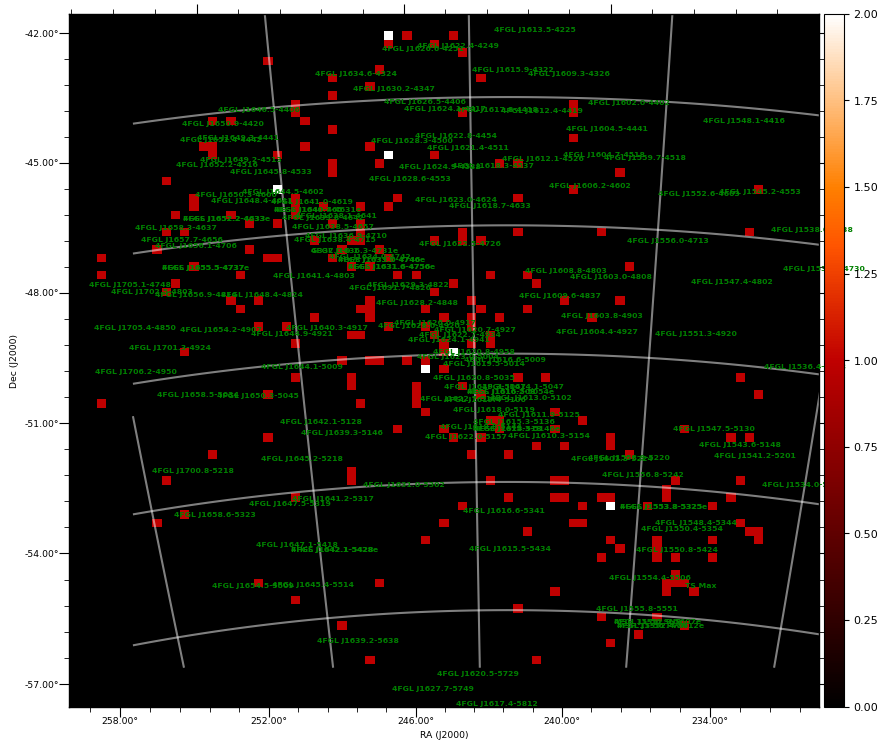
| TS MAXIMUM |
|---|
|
TS = 10.8 |
Ra | 235.73° |
| Dec | -55.12° |
| Nearby 4FGL sources | 0 |
| Sun in this pixel? | False |
| Moon in this pixel? | False |
|
|
TS MAP |
COUNT MAP |
|
|
|
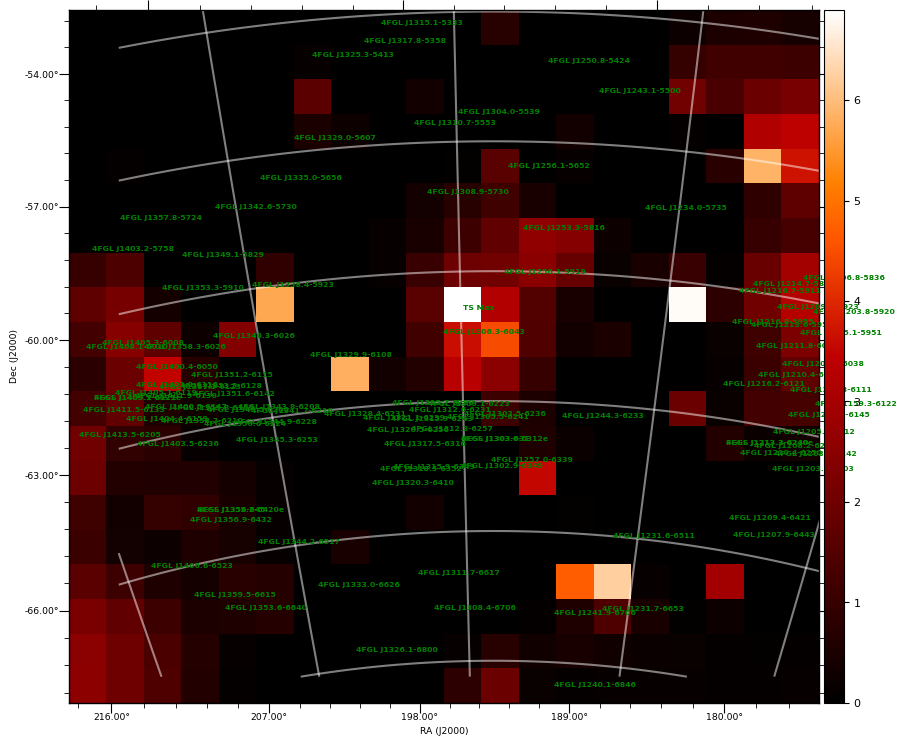
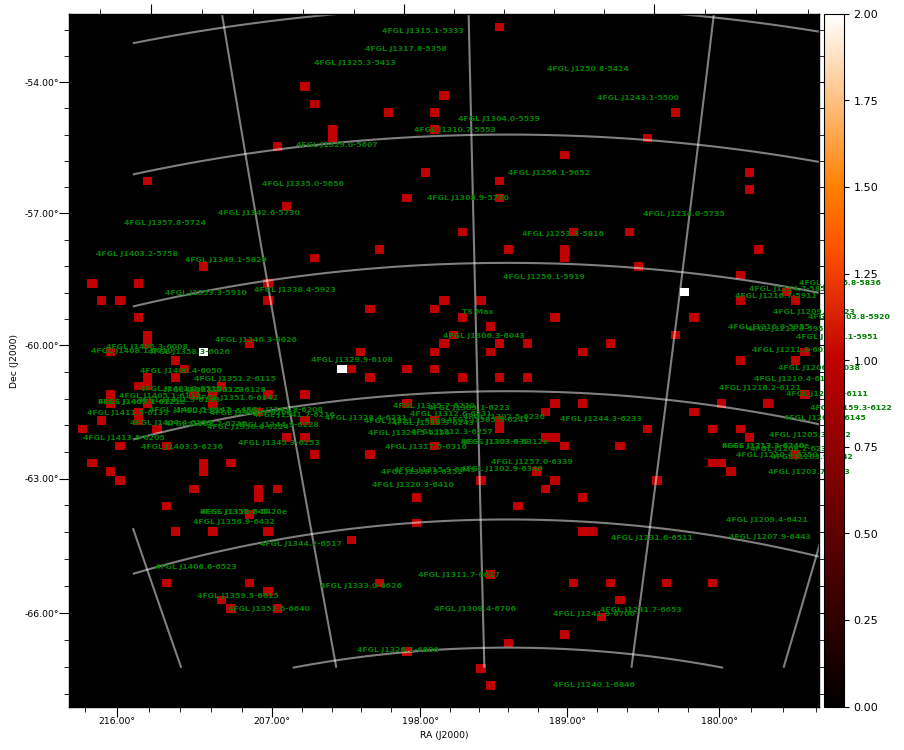
| TS MAXIMUM |
|---|
|
TS = 6.9 |
Ra | 195.75° |
| Dec | -60.16° |
| Nearby 4FGL sources | 1 |
| 4FGL J1306.3-6043 | Δ=0.7° |
| Sun in this pixel? | False |
| Moon in this pixel? | False |
|
|
TS MAP |
COUNT MAP |
|
|
|
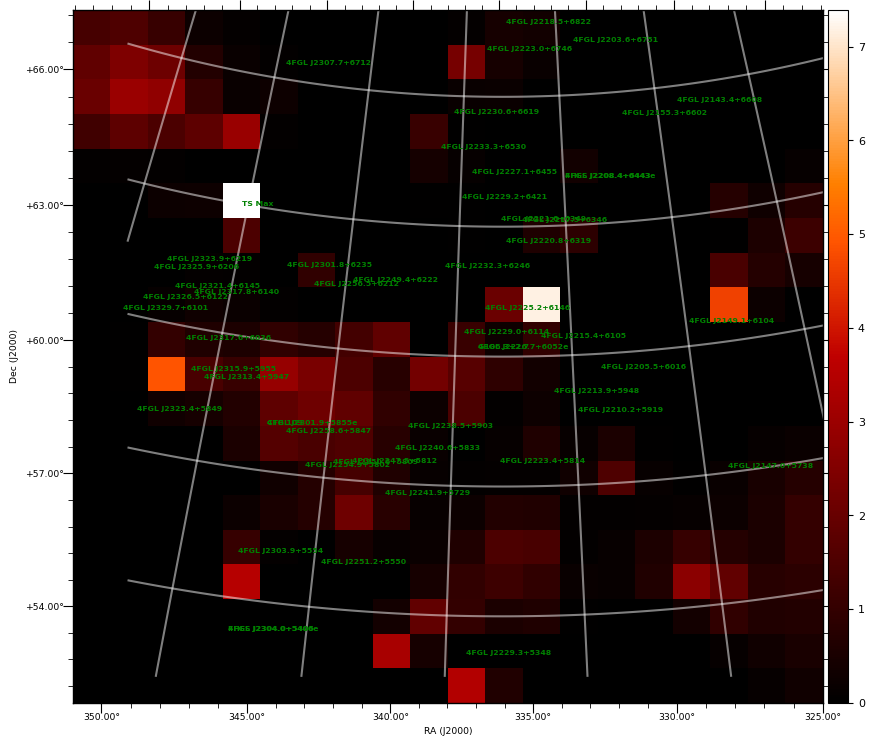
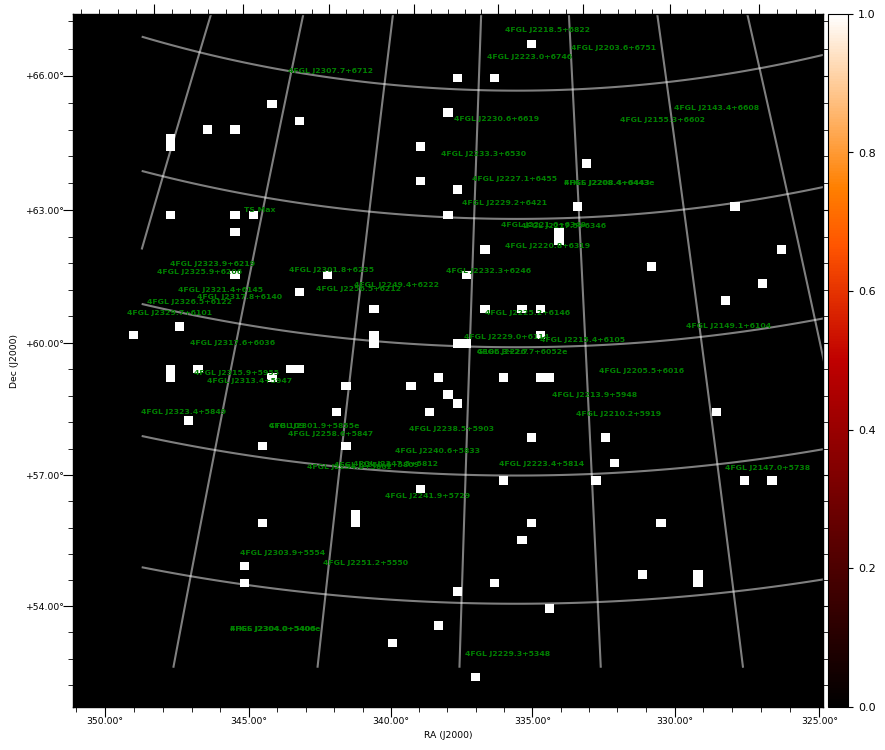
| TS MAXIMUM |
|---|
|
TS = 7.4 |
Ra | 348.0° |
| Dec | 63.87° |
| Nearby 4FGL sources | 0 |
| Sun in this pixel? | False |
| Moon in this pixel? | False |
|
|
TS MAP |
COUNT MAP |
|
|
|
|
|