| GWFUP ANALYSIS REPORT FOR GW S230824r |
|
|
|
| SUMMARY | |
| Name | S230824r |
| Trigger MET | 714540652.73 |
| Date | 2023-08-24 |
| Time | 03:30:47 |
| In SAA? | False |
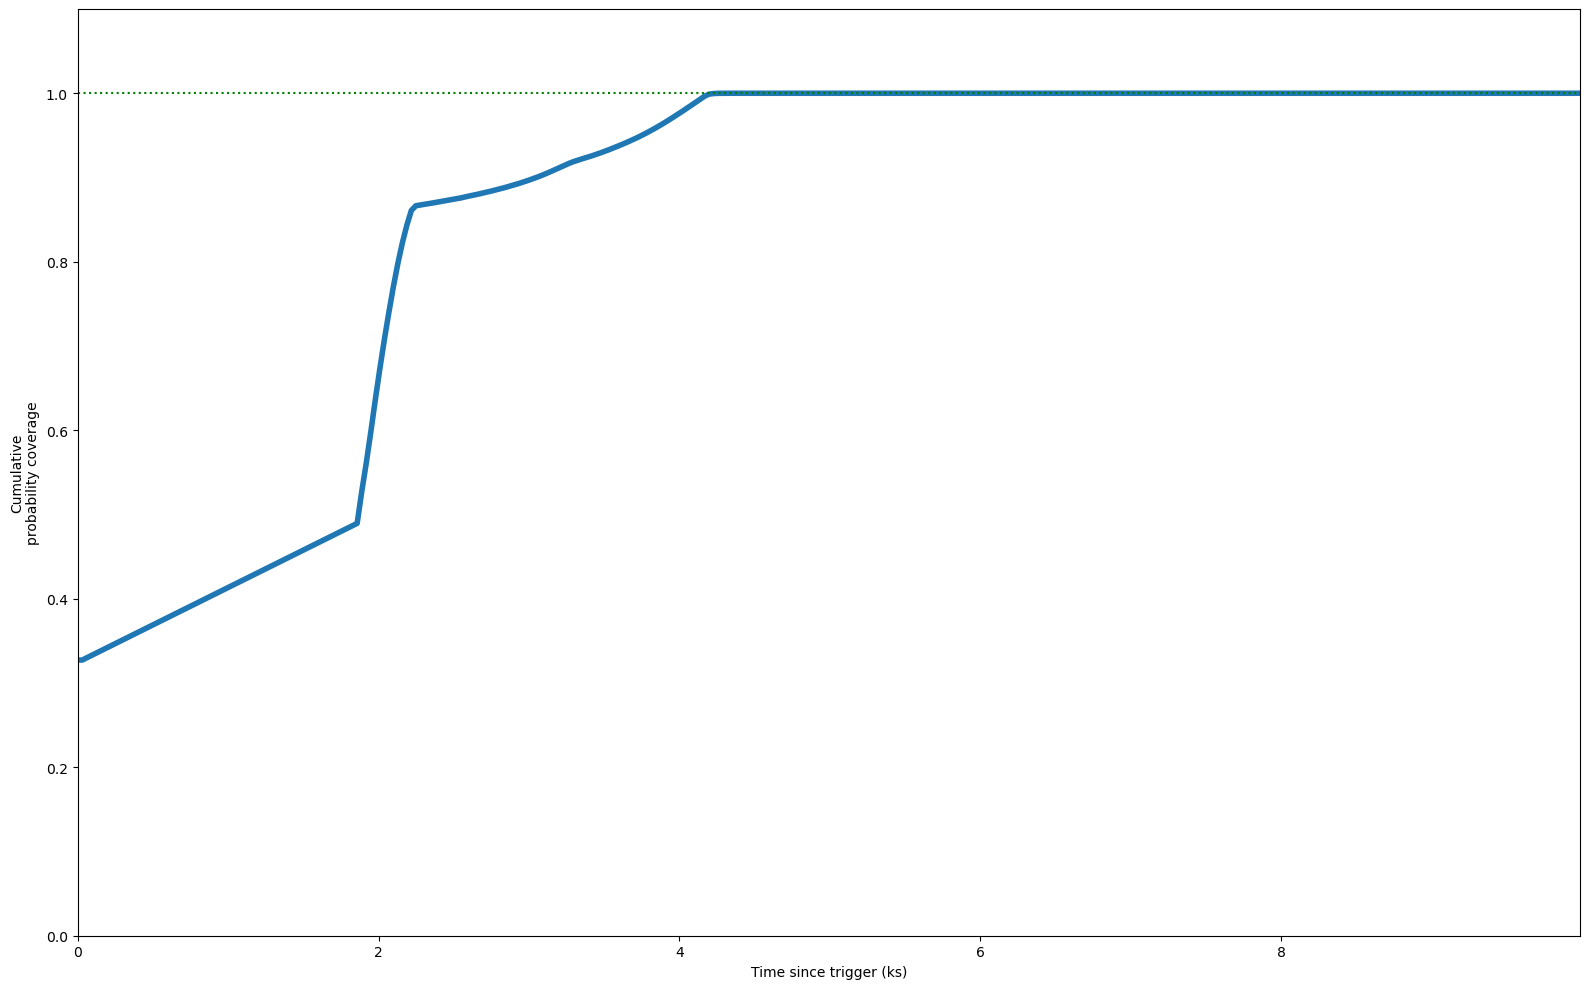
| Inst Coverage | 32.7% |
| T Max Coverage | 4.4 ks (100.0%) |
| E Min | 100.0 MeV |
| E Max | 100000.0 MeV |
| T Start | 0.0 s |
| T Stop | 10000.0 s |
| Theta Max | 65.0° |
| Z Max | 100.0° |
| ROI | 8.0° |
| IRF | p8_source |
| Galactic Model | template |
| Strategy | time |
| Particle Model | isotr template |
| NSide | 64 |
| Version | v02 |
|
| COVERAGE |
|
|
| FIXED TIME INTERVAL ANALYSIS |
|
| TS MAXIMUM |
|---|
|
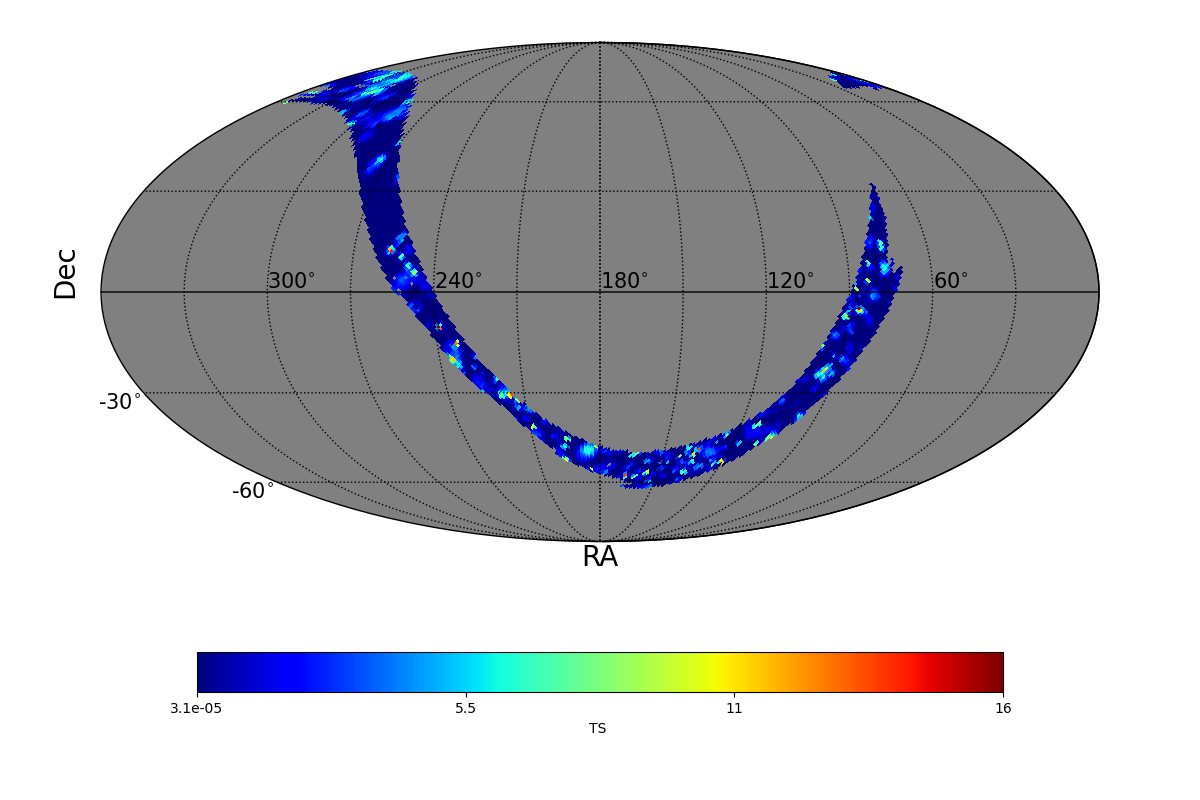
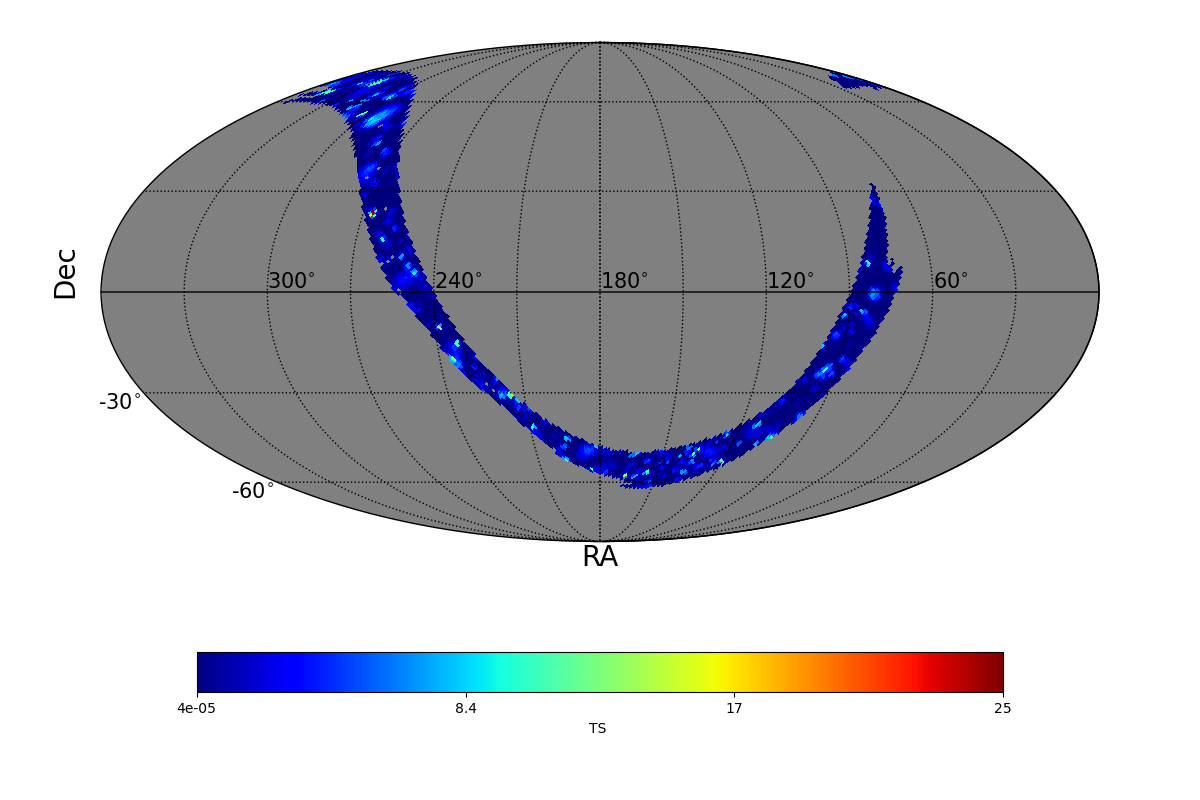
TS = 16.4 |
Ra | 86.48° |
| Dec | -4.78° |
| Nearby 4FGL sources | 0 |
| Sun in this pixel? | False |
| Moon in this pixel? | False |
| LIST OF OTHER TS > 25.0 |
|---|
|
| TS MAP |
|
|
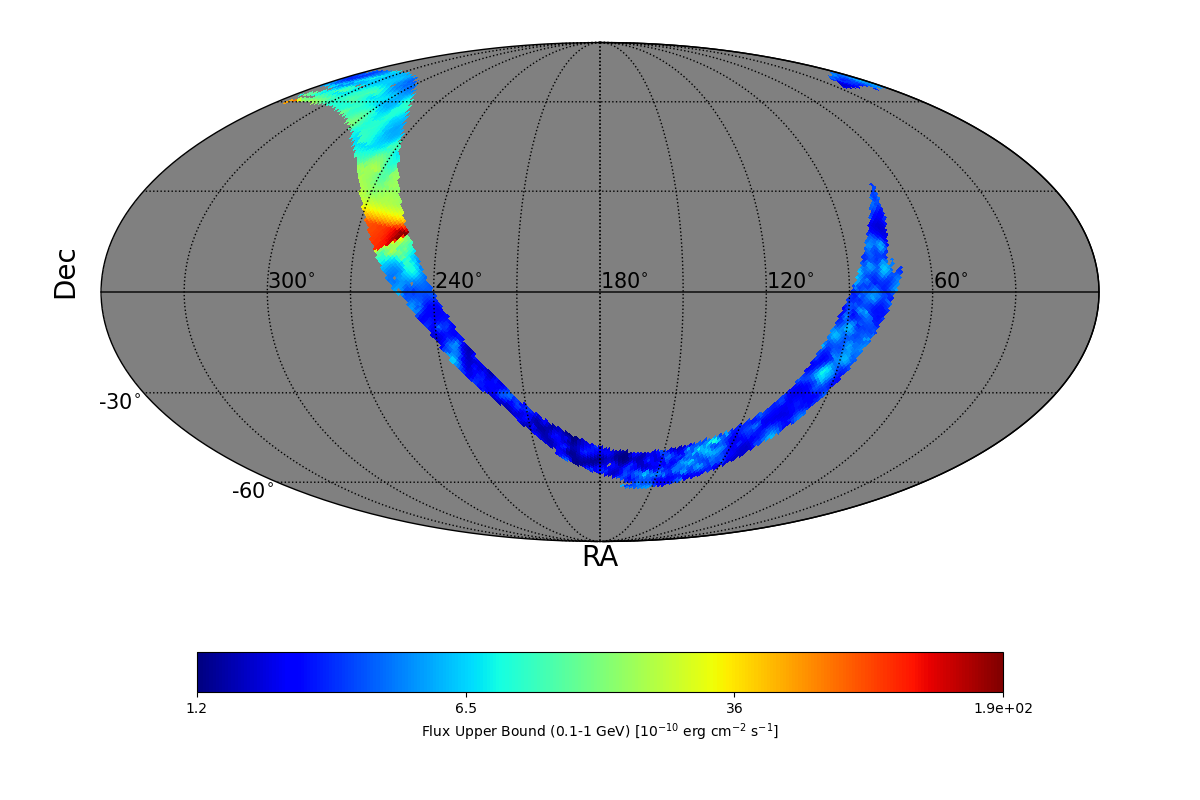
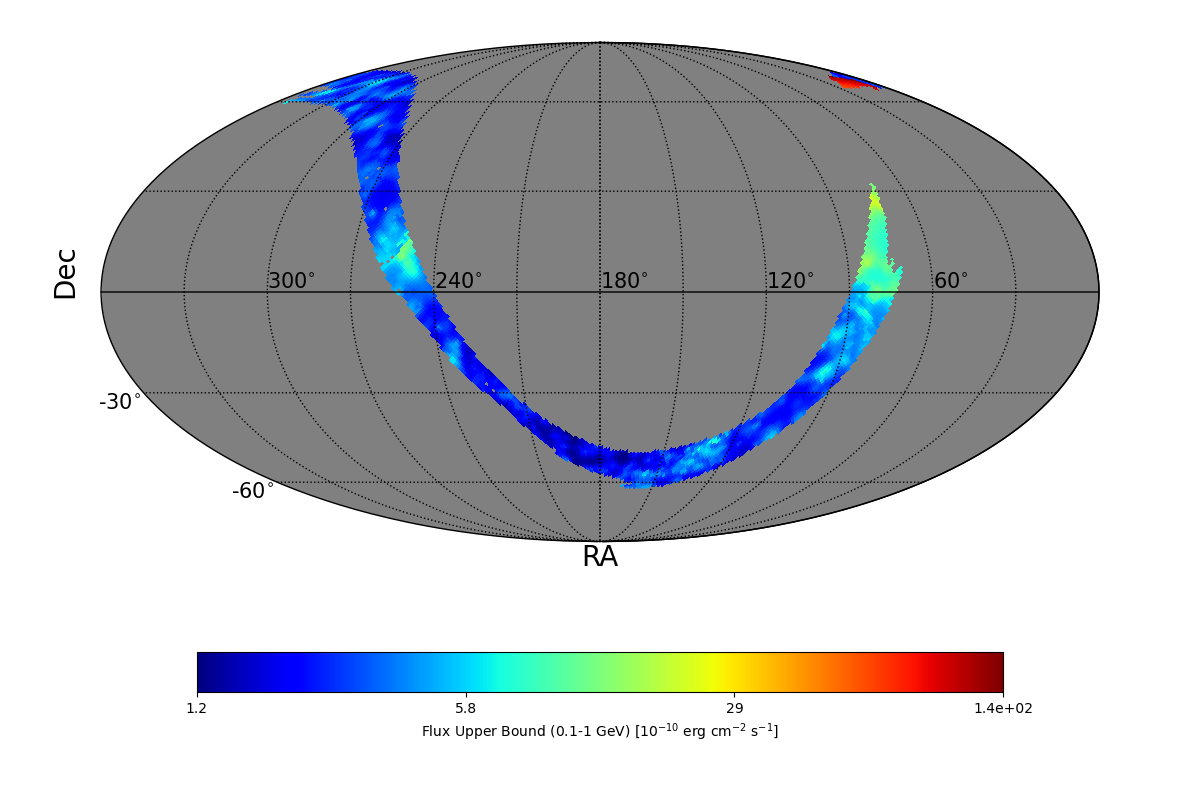
| FLUX UB EXTREMES |
| UB min | 1.2 e-10 erg cm-2 s-1 |
| UB max | 19.4 e-9 erg cm-2 s-1 |
| BAYESIAN FLUX UB (CL=95%) |
| Photon flux | 17.42 e-7 ph cm-2 s-1 |
| Energy flux | 8.13 e-10 erg cm-2 s-1 |
|
| UL MAP |
|
|
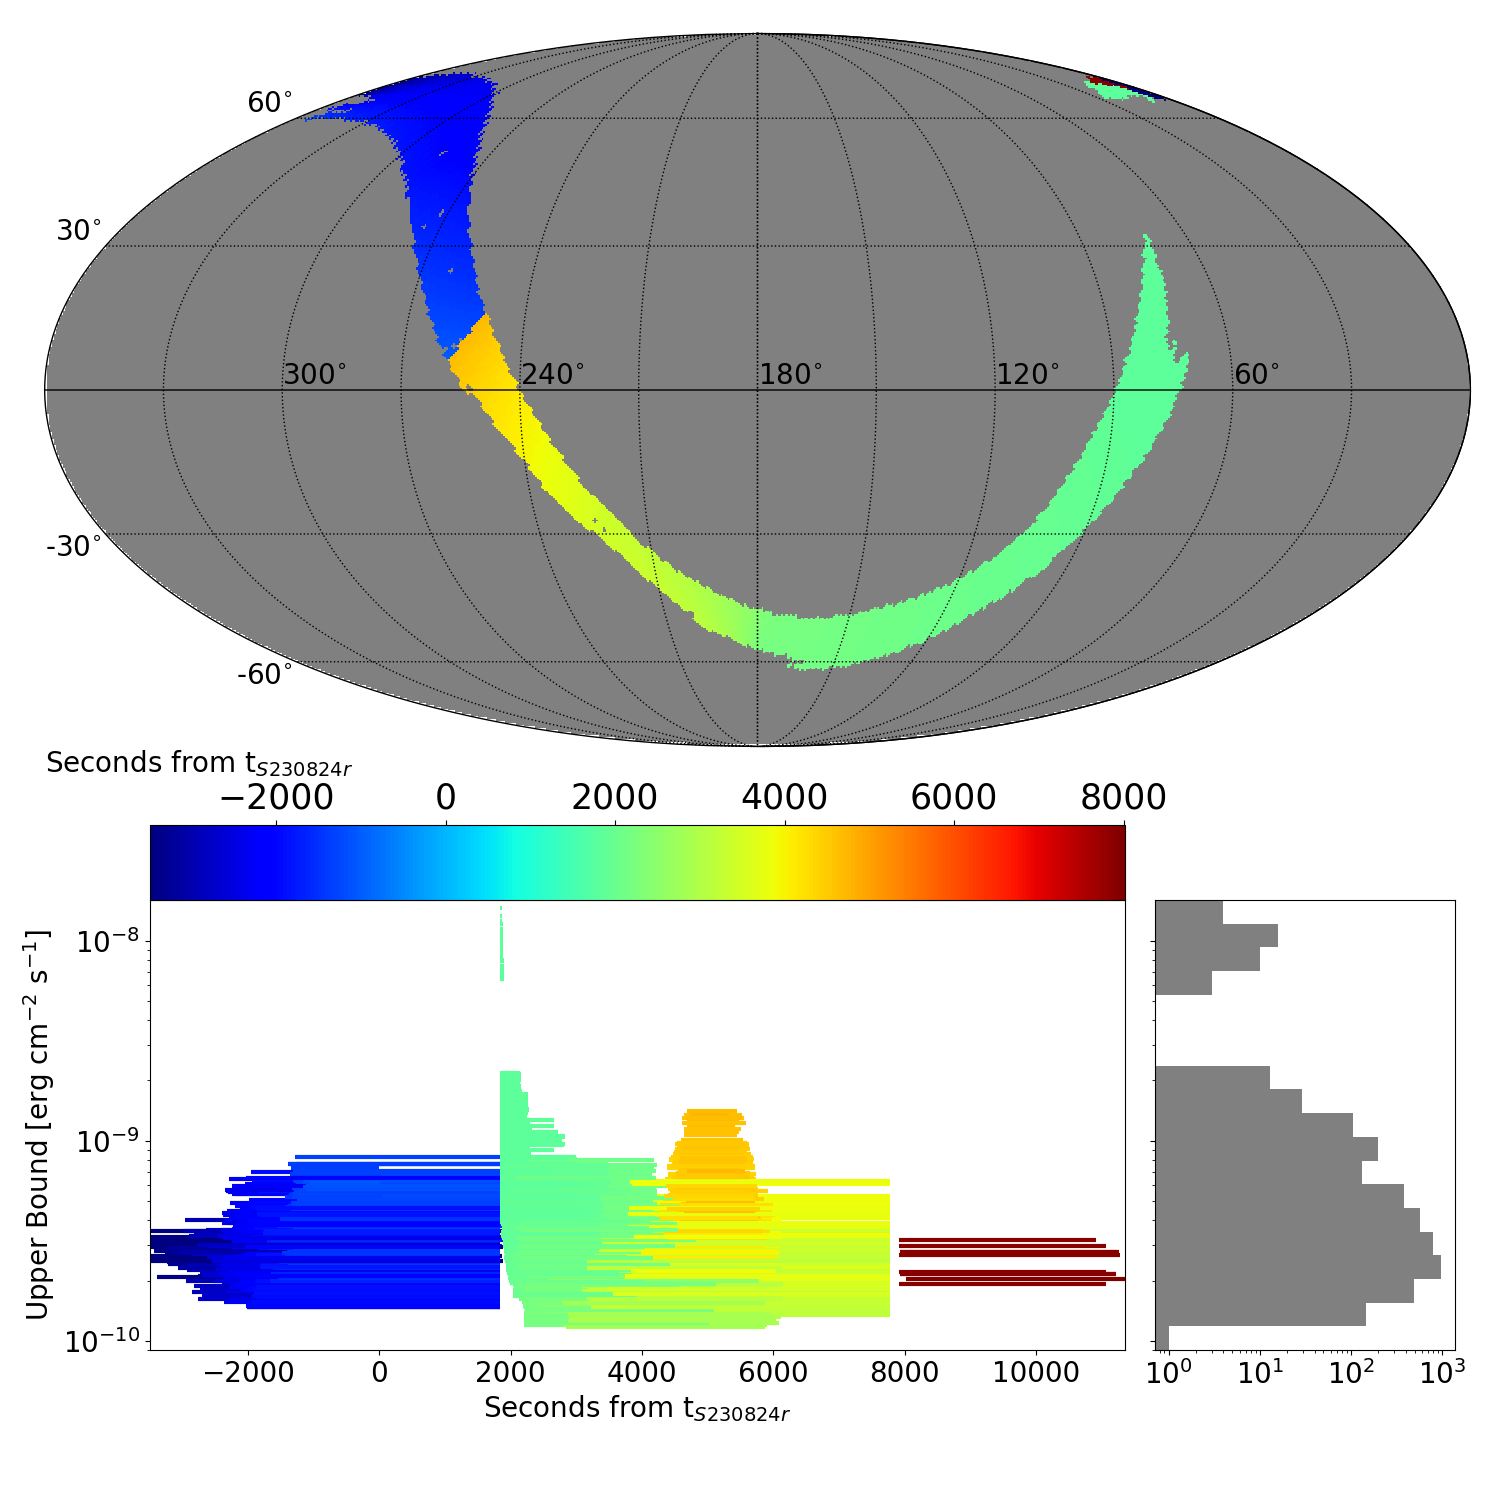
| ADAPTIVE TIME INTERVAL ANALYSIS |
|
|
|
DISTRIBUTION OF THE UPPER BOUNDS |
|
|
| TS MAXIMUM |
|---|
|
TS = 25.3 |
Ra | 267.19° |
| Dec | 23.97° |
| Nearby 4FGL sources | 1 |
| 4FGL J1747.4+2330 | Δ=0.55° |
| Sun in this pixel? | False |
| Moon in this pixel? | False |
| LIST OF OTHER TS > 25.0 |
|---|
|
|
TS MAP |
|
|
| FLUX UB EXTREMES |
| UB min | 1.17 e-10 erg cm-2 s-1 |
| UB max | 14.5 e-9 erg cm-2 s-1 |
|
|
UL MAP |
|
|
|
|
| SIGMA MAXIMUM |
|---|
|
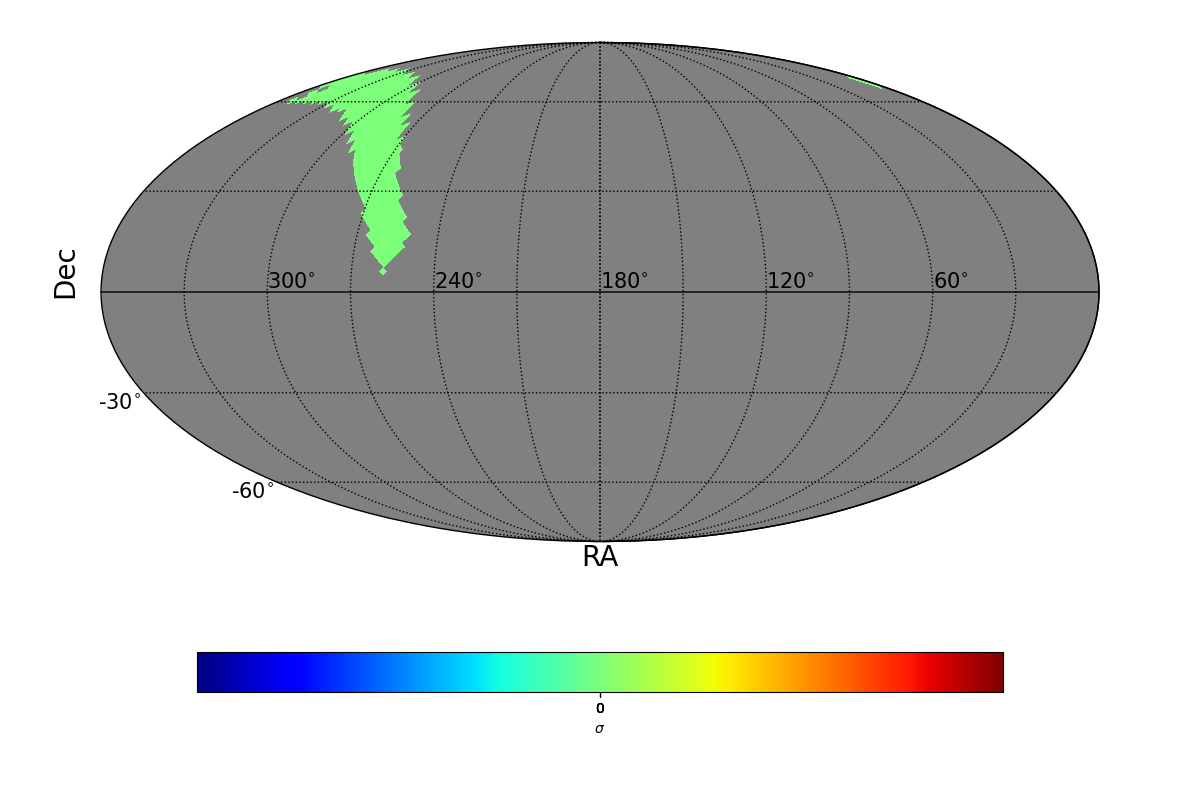
SIGMA = 0.0 |
Ra | 333.75° |
| Dec | 72.39° |
| Nearby 4FGL sources | 0 |
| Sun in this pixel? | False |
| Moon in this pixel? | False |
| LIST OF OTHER SIGMA > 4 |
|---|
|
|
SIGMA MAP |
|
|
|
|
|
|
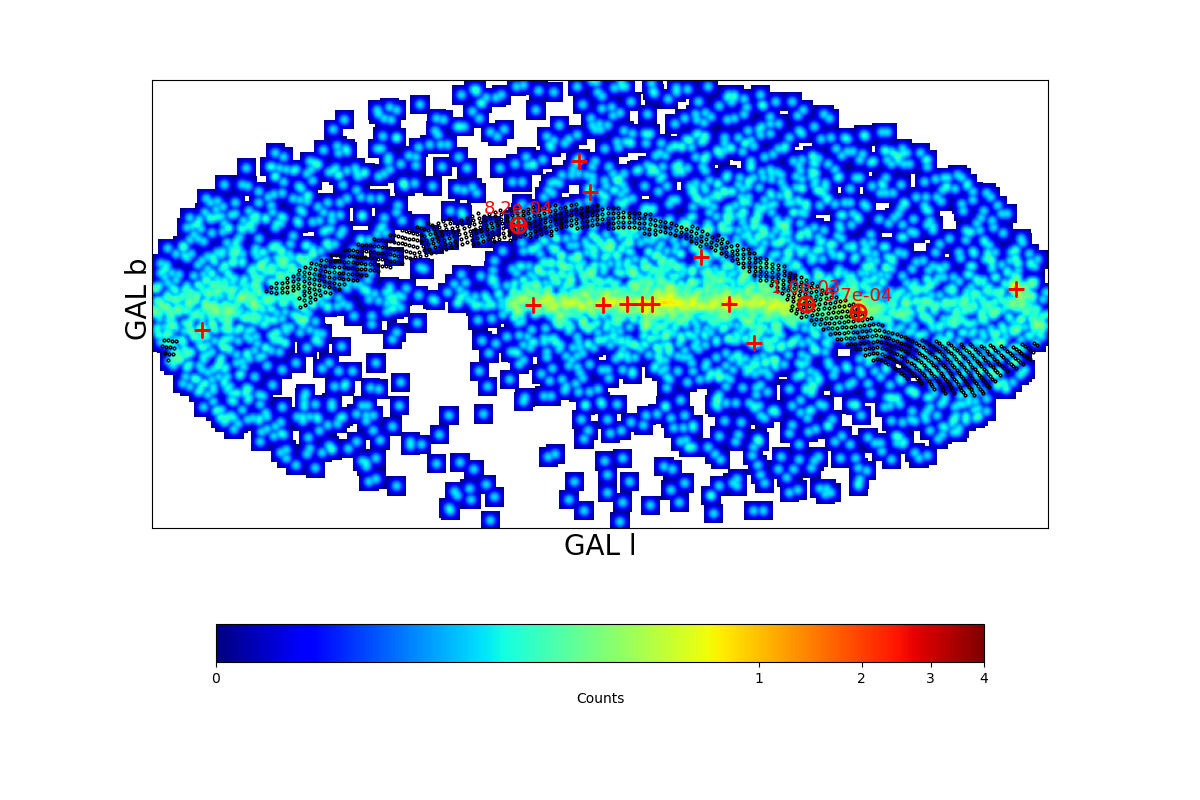
COUNT MAP |
|
|
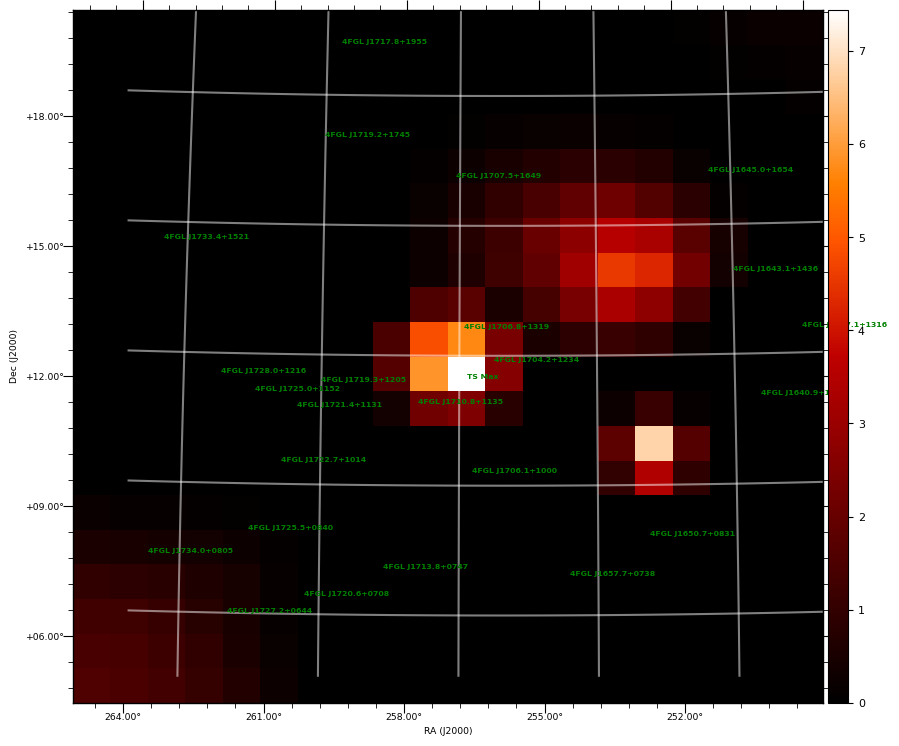
| TS MAXIMUM |
|---|
|
TS = 7.4 |
Ra | 256.65° |
| Dec | 12.19° |
| Nearby 4FGL sources | 1 |
| 4FGL J1704.2+1234 | Δ=0.69° |
| Sun in this pixel? | False |
| Moon in this pixel? | False |
|
|
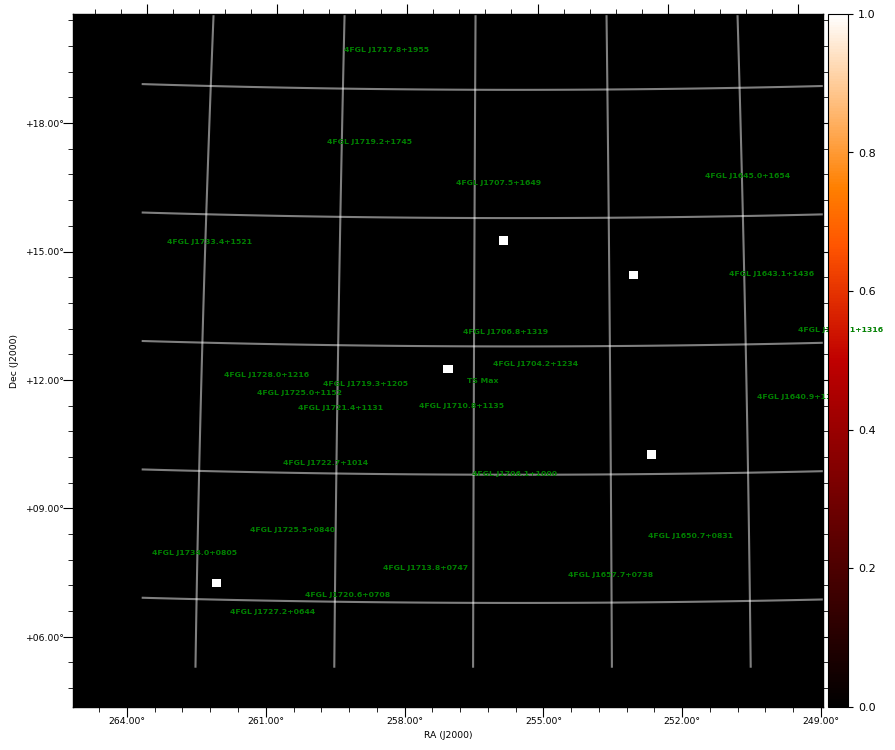
TS MAP |
COUNT MAP |
|
|
|
| TS MAXIMUM |
|---|
|
TS = 7.9 |
Ra | 135.54° |
| Dec | -49.98° |
| Nearby 4FGL sources | 1 |
| 4FGL J0904.7-4908 | Δ=0.93° |
| Sun in this pixel? | False |
| Moon in this pixel? | False |
|
|
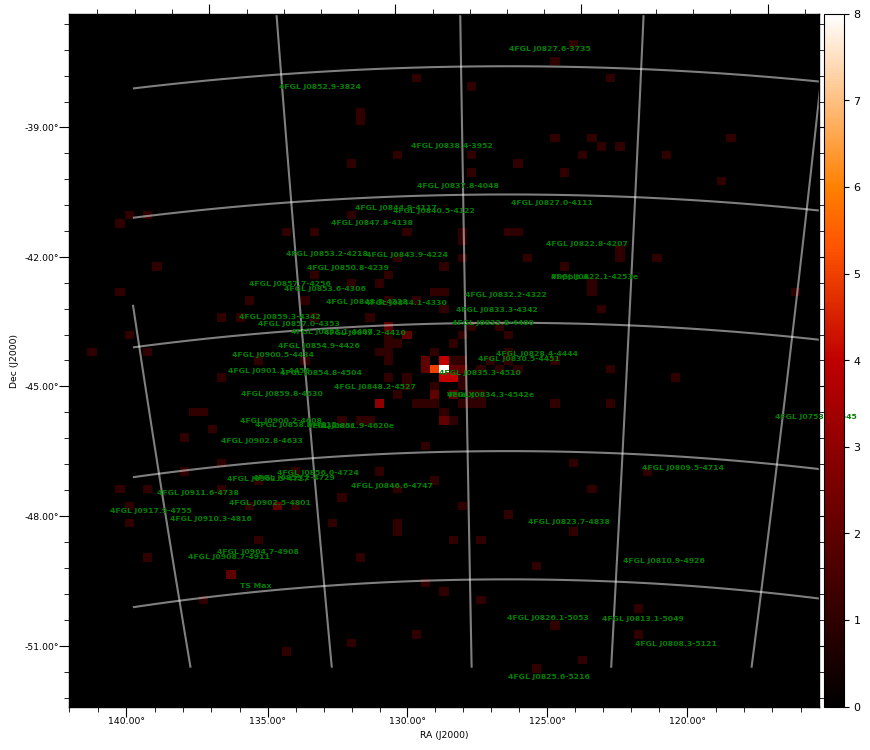
TS MAP |
COUNT MAP |
|
|
|
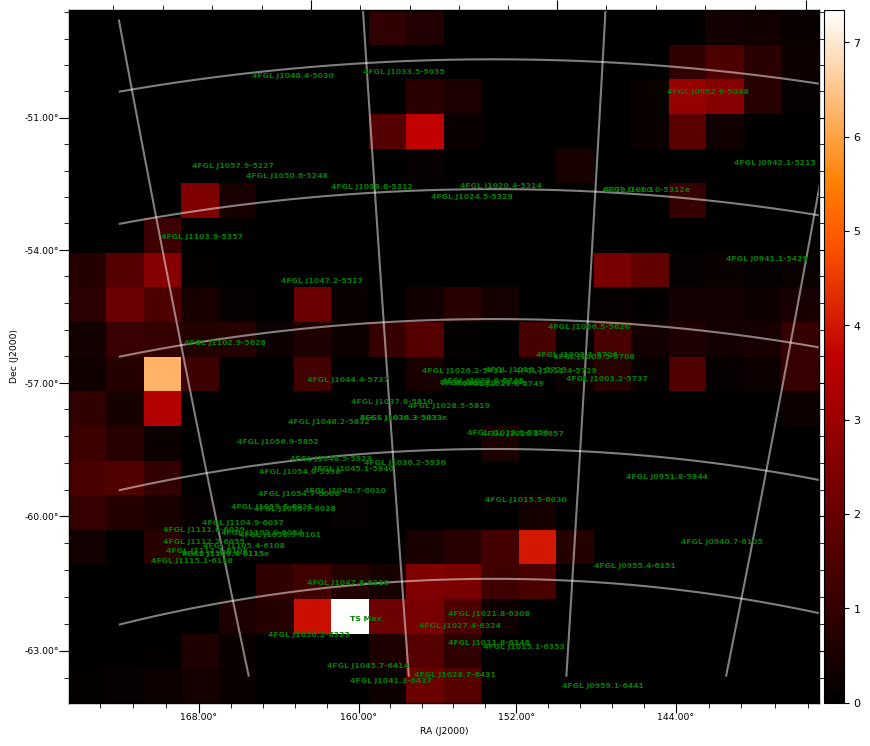
| TS MAXIMUM |
|---|
|
TS = 7.3 |
Ra | 160.12° |
| Dec | -63.2° |
| Nearby 4FGL sources | 0 |
| Sun in this pixel? | False |
| Moon in this pixel? | False |
|
|
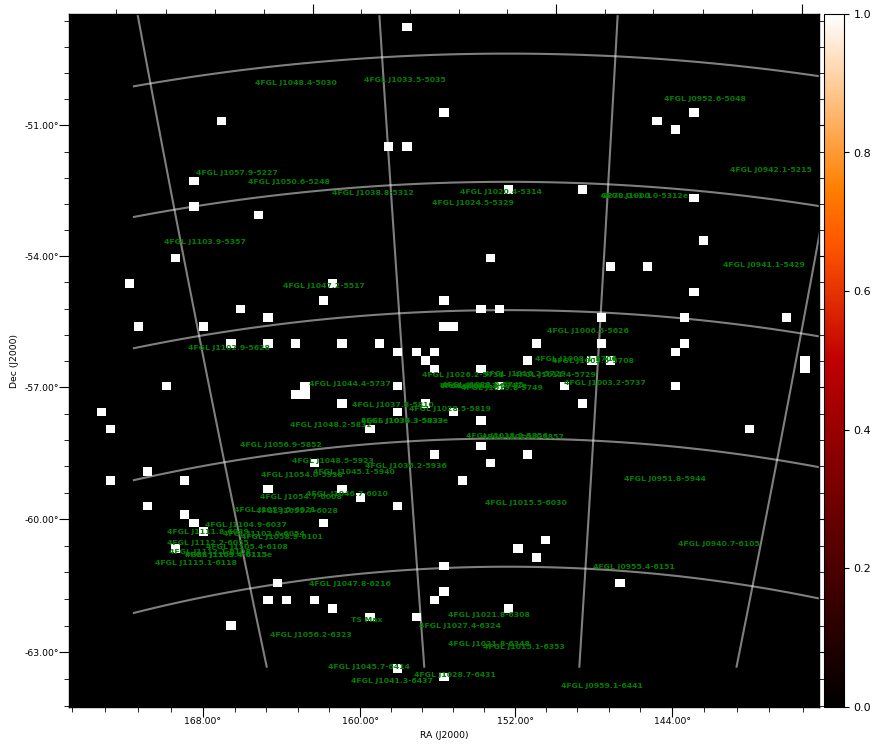
TS MAP |
COUNT MAP |
|
|
|
|
|