| GWFUP ANALYSIS REPORT FOR GW S230822bm |
|
|
|
| SUMMARY | |
| Name | S230822bm |
| Trigger MET | 714438222.47 |
| Date | 2023-08-22 |
| Time | 23:03:37 |
| In SAA? | True |
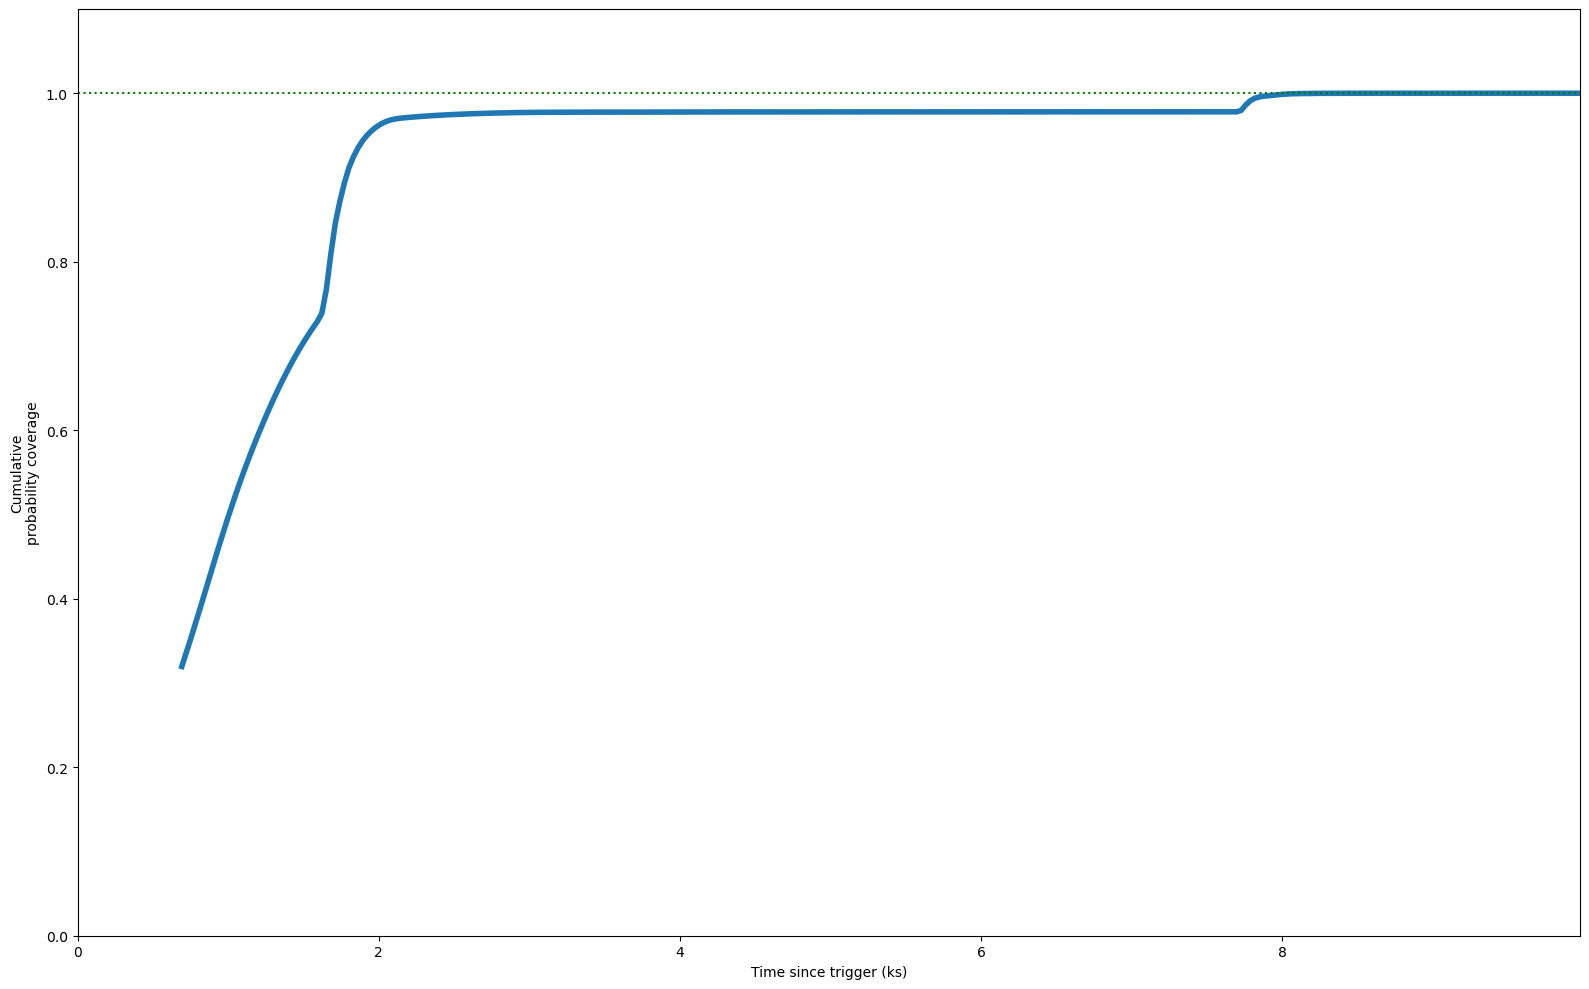
| Inst Coverage | 32.0% (0.7 ks) |
| T Max Coverage | 8.9 ks (100.0%) |
| E Min | 100.0 MeV |
| E Max | 100000.0 MeV |
| T Start | 0.0 s |
| T Stop | 10000.0 s |
| Theta Max | 65.0° |
| Z Max | 100.0° |
| ROI | 8.0° |
| IRF | p8_source |
| Galactic Model | template |
| Strategy | time |
| Particle Model | isotr template |
| NSide | 64 |
| Version | v02 |
|
| COVERAGE |
|
|
| FIXED TIME INTERVAL ANALYSIS |
|
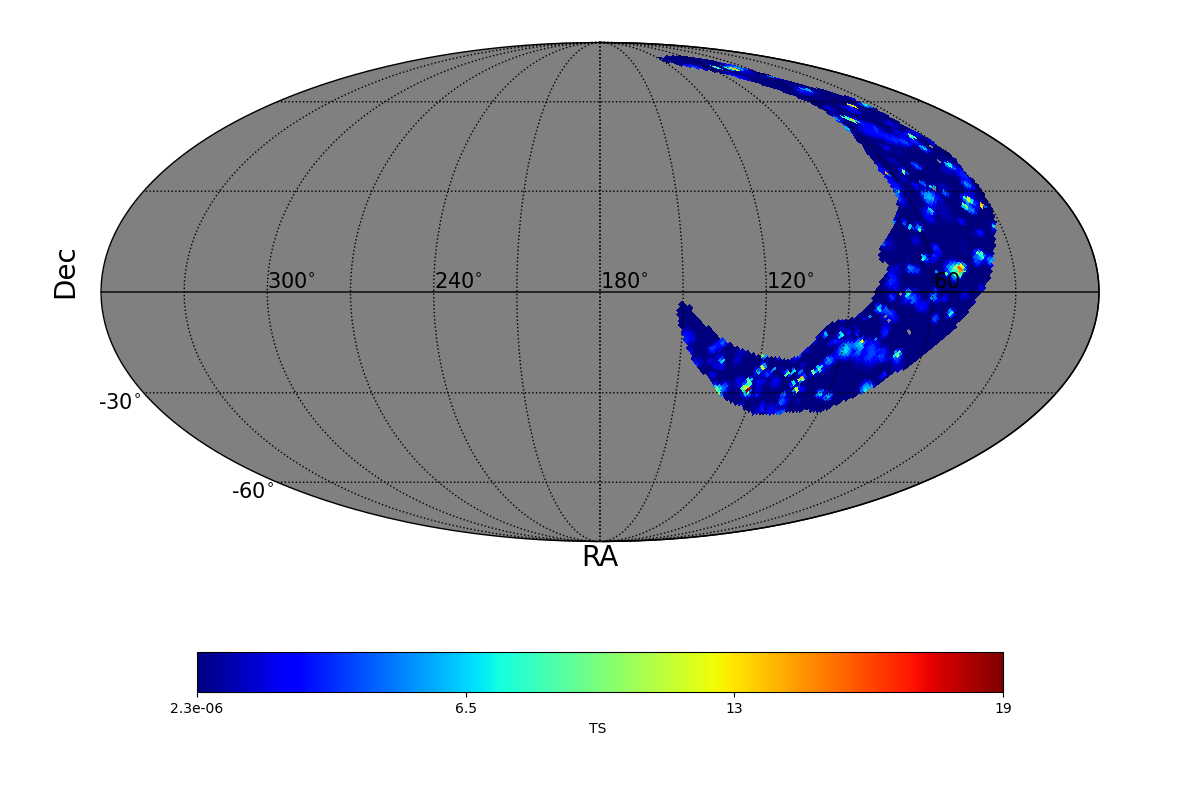
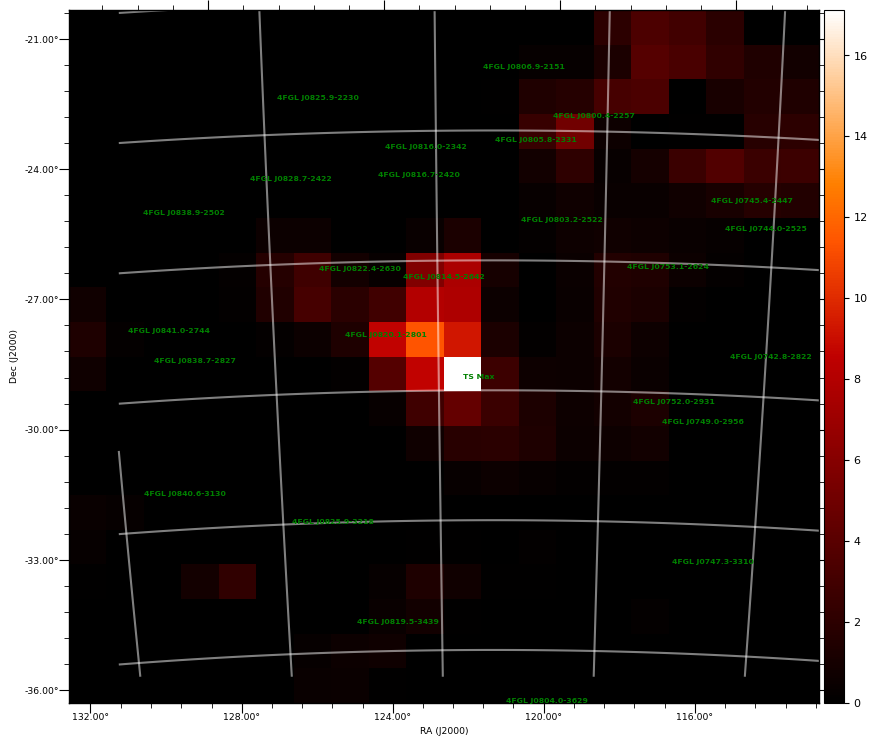
| TS MAXIMUM |
|---|
|
TS = 18.8 |
Ra | 121.64° |
| Dec | -28.63° |
| Nearby 4FGL sources | 0 |
| Sun in this pixel? | False |
| Moon in this pixel? | False |
| LIST OF OTHER TS > 25.0 |
|---|
|
| TS MAP |

|
|
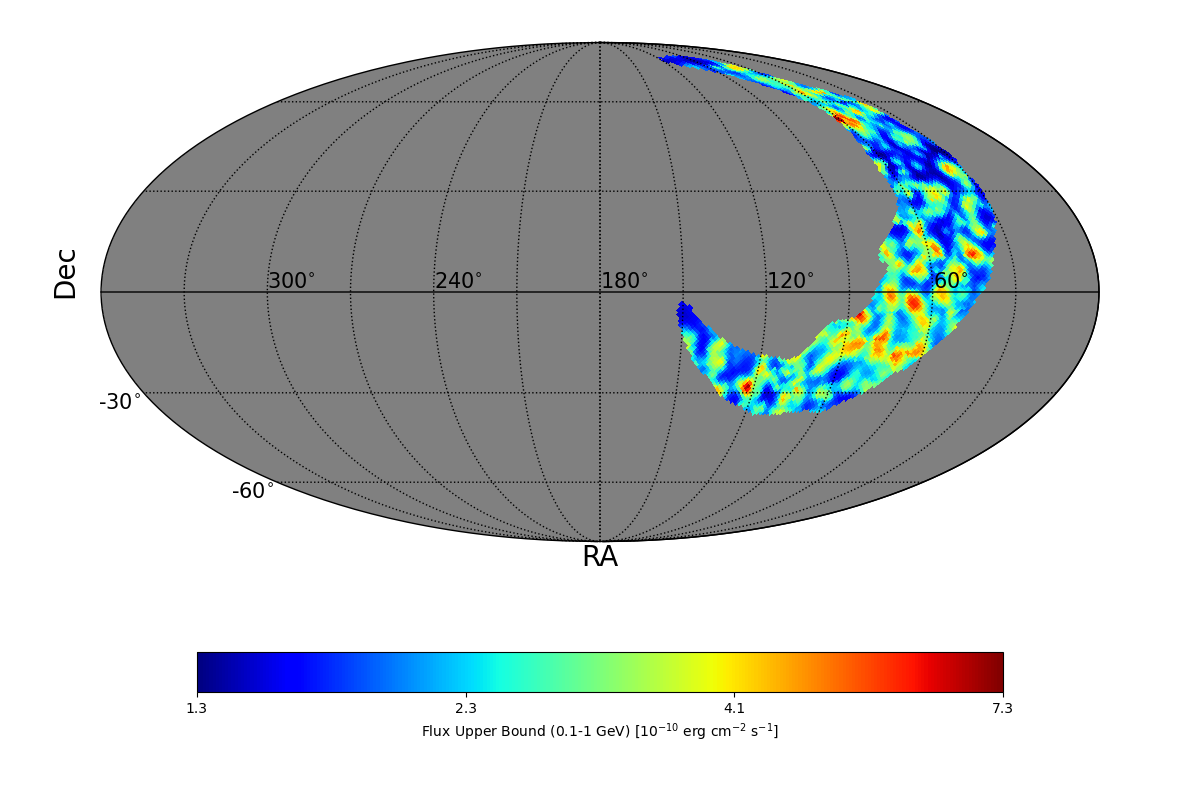
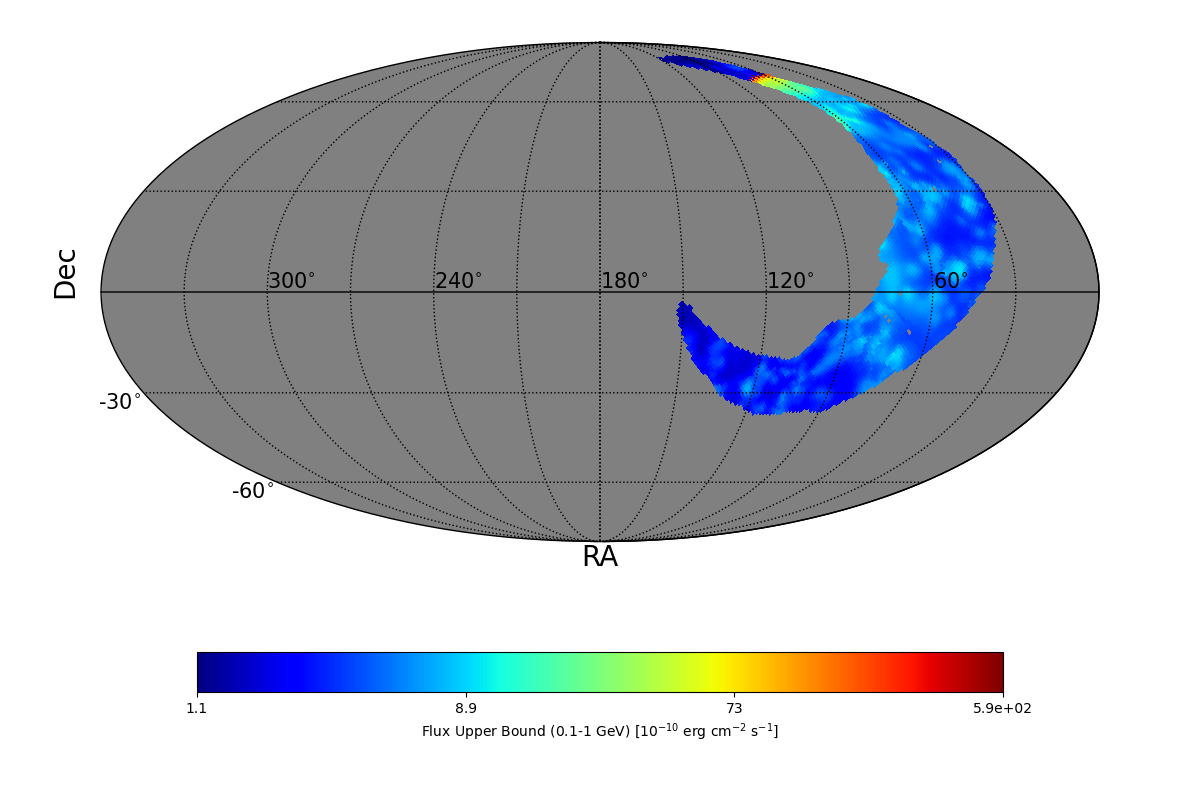
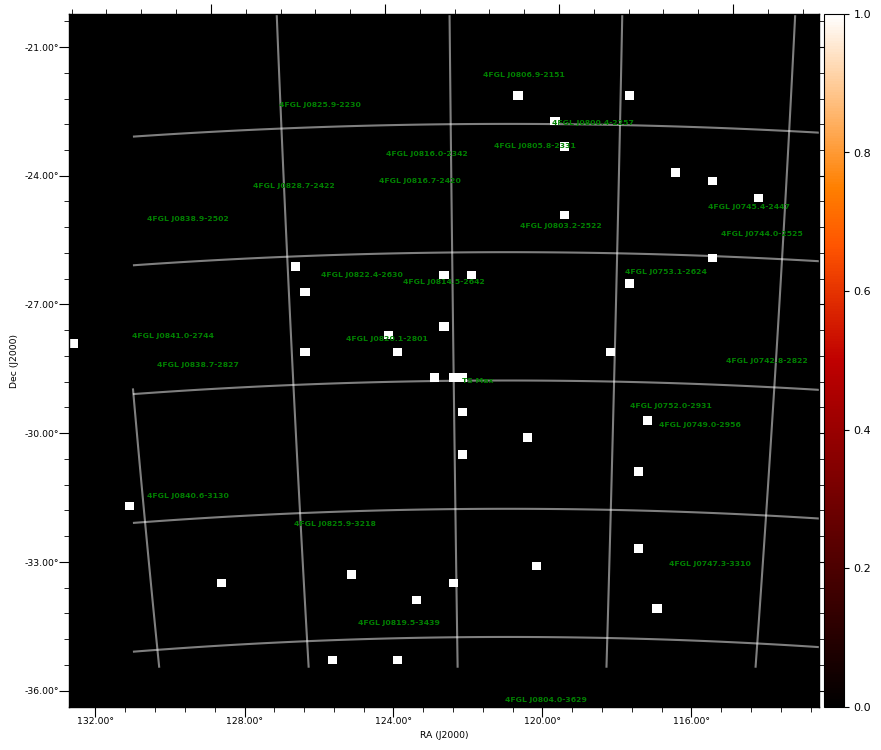
| FLUX UB EXTREMES |
| UB min | 1.3 e-10 erg cm-2 s-1 |
| UB max | 0.7 e-9 erg cm-2 s-1 |
| BAYESIAN FLUX UB (CL=95%) |
| Photon flux | 11.59 e-7 ph cm-2 s-1 |
| Energy flux | 4.53 e-10 erg cm-2 s-1 |
|
| UL MAP |
|
|
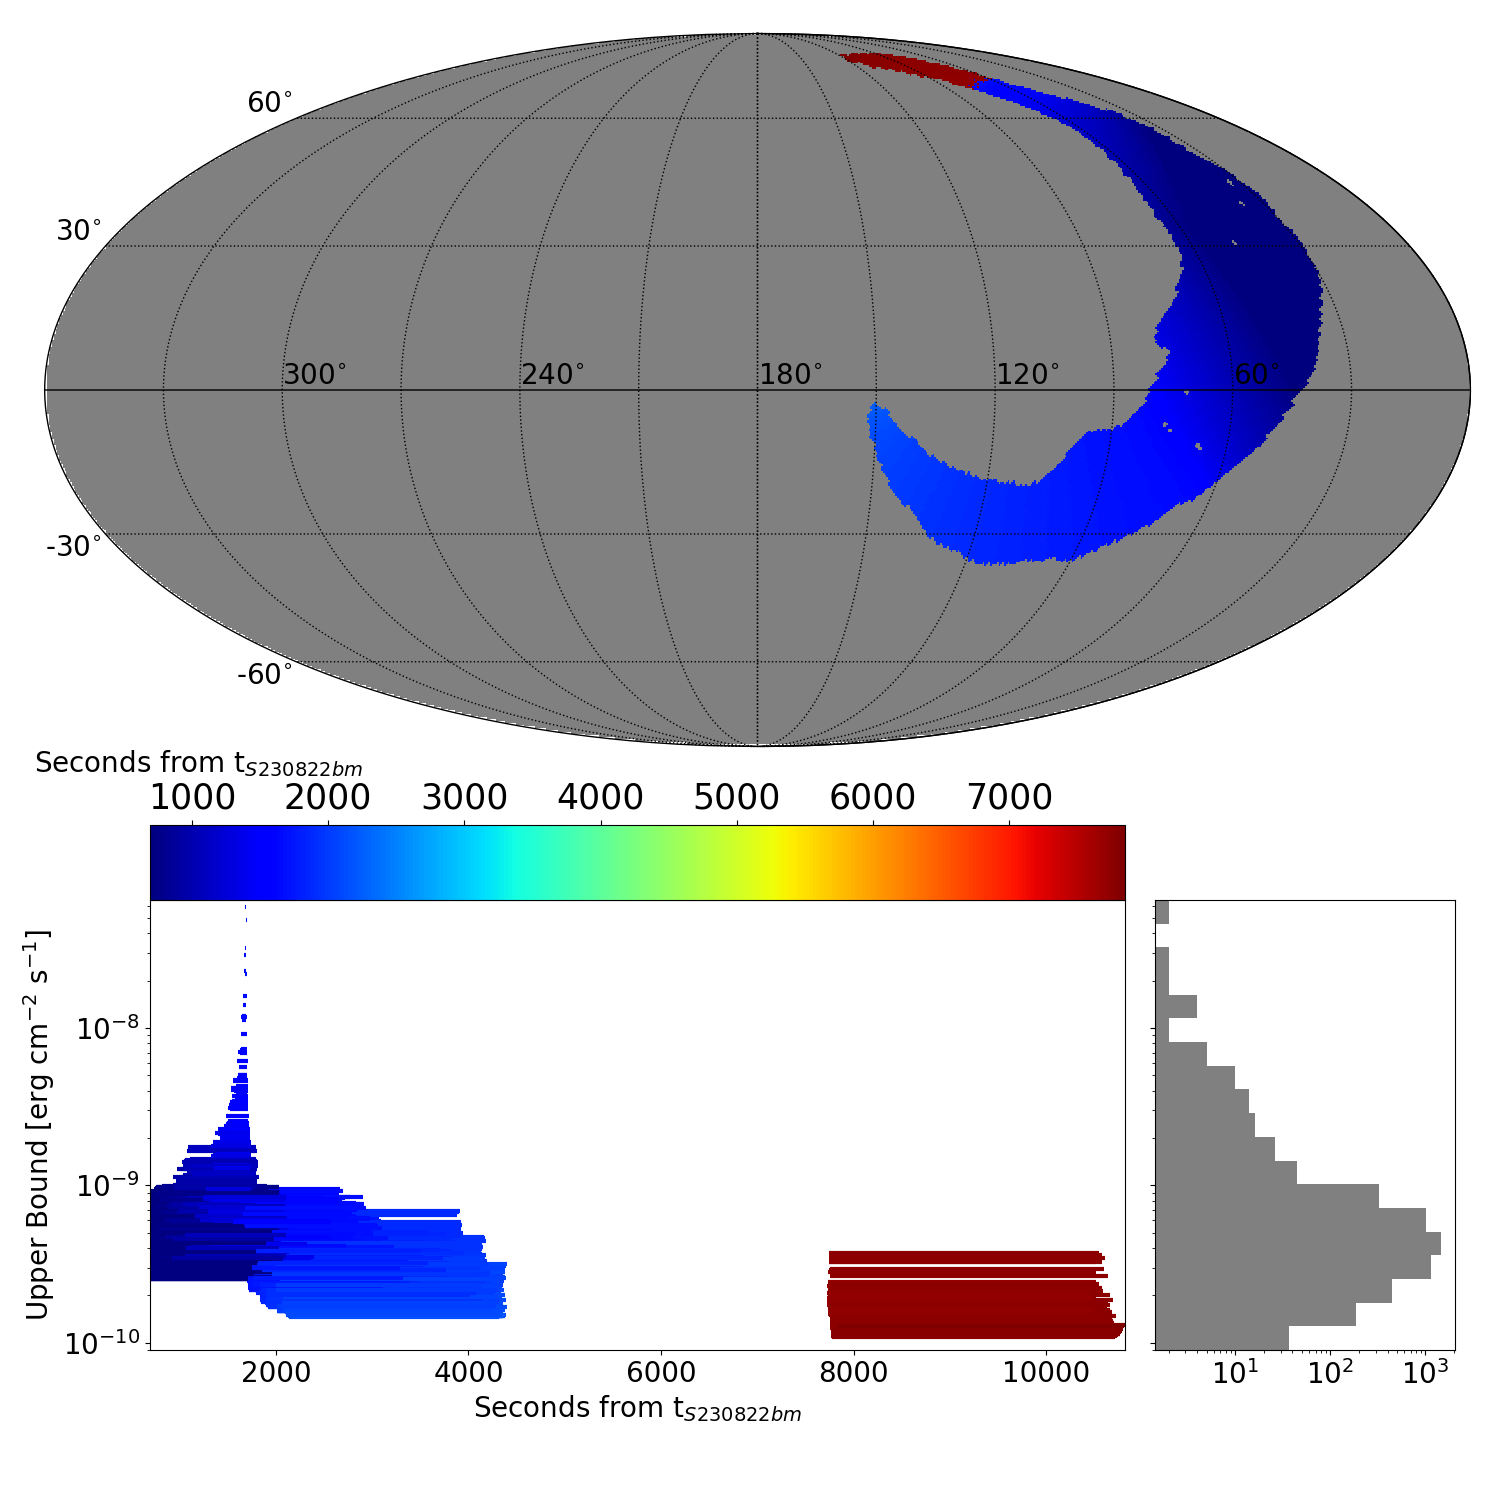
| ADAPTIVE TIME INTERVAL ANALYSIS |
|
|
|
DISTRIBUTION OF THE UPPER BOUNDS |
|
|
| TS MAXIMUM |
|---|
|
TS = 19.5 |
Ra | 122.34° |
| Dec | -29.31° |
| Nearby 4FGL sources | 0 |
| Sun in this pixel? | False |
| Moon in this pixel? | False |
| LIST OF OTHER TS > 25.0 |
|---|
|
|
TS MAP |
|
|
| FLUX UB EXTREMES |
| UB min | 1.09 e-10 erg cm-2 s-1 |
| UB max | 59.3 e-9 erg cm-2 s-1 |
|
|
UL MAP |
|
|
|
|
|
|
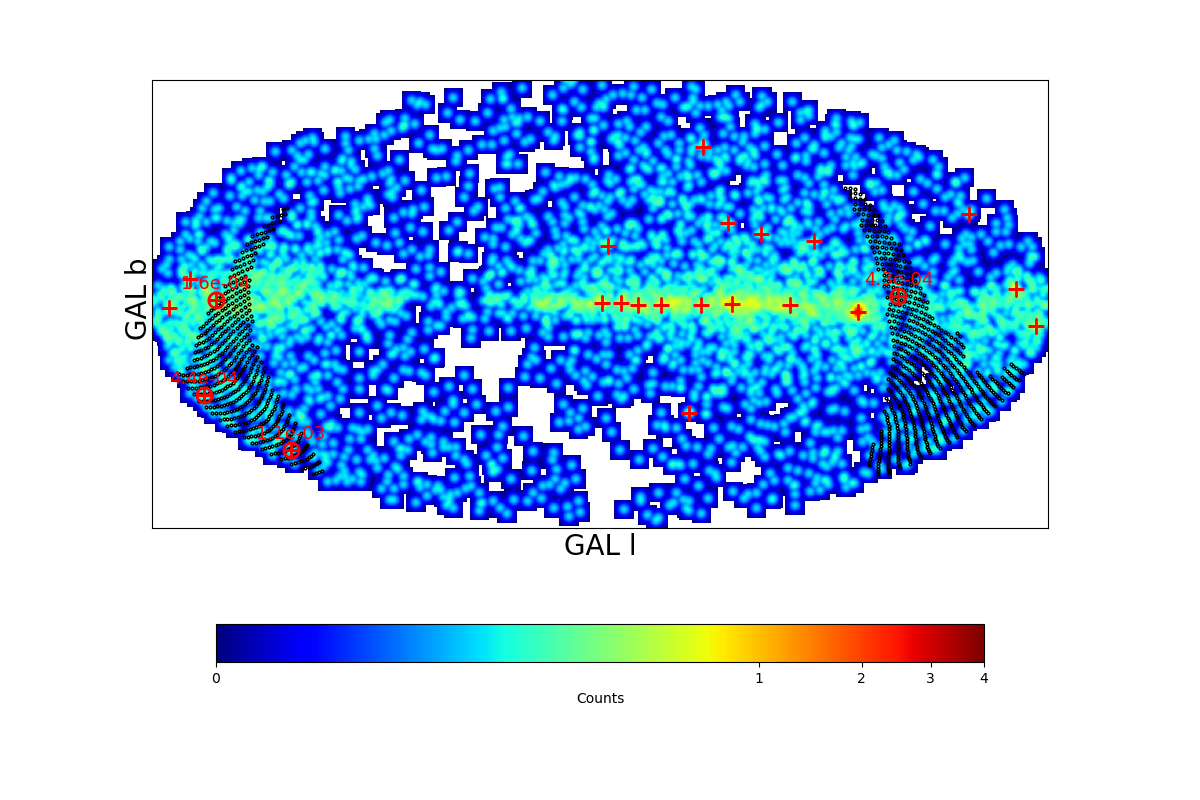
COUNT MAP |
|
|
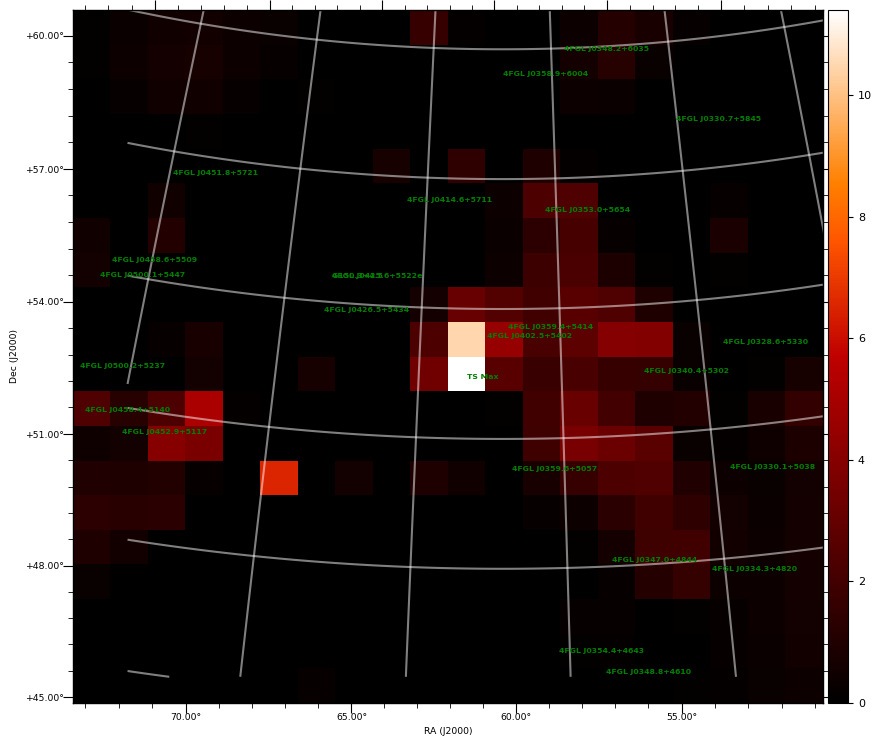
| TS MAXIMUM |
|---|
|
TS = 11.4 |
Ra | 61.4° |
| Dec | 53.11° |
| Nearby 4FGL sources | 0 |
| Sun in this pixel? | False |
| Moon in this pixel? | False |
|
|
TS MAP |
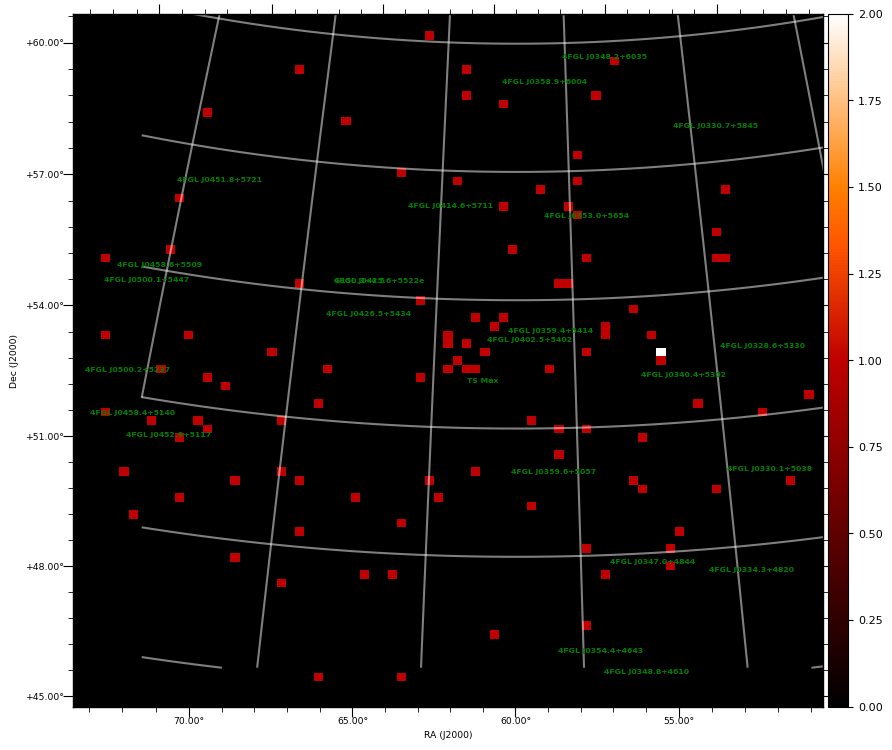
COUNT MAP |
|
|
|
| TS MAXIMUM |
|---|
|
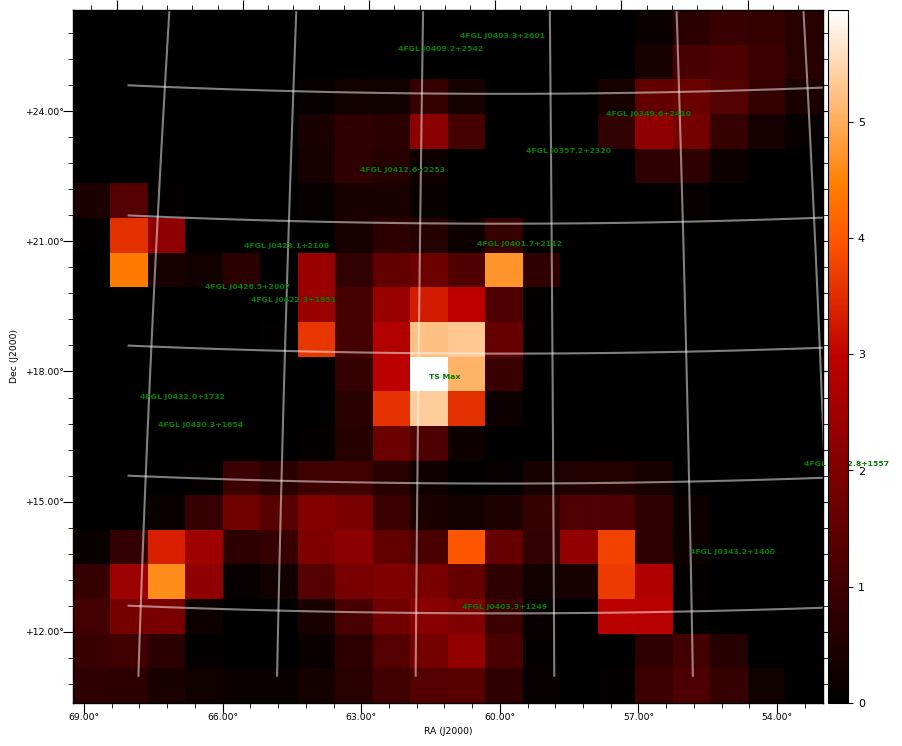
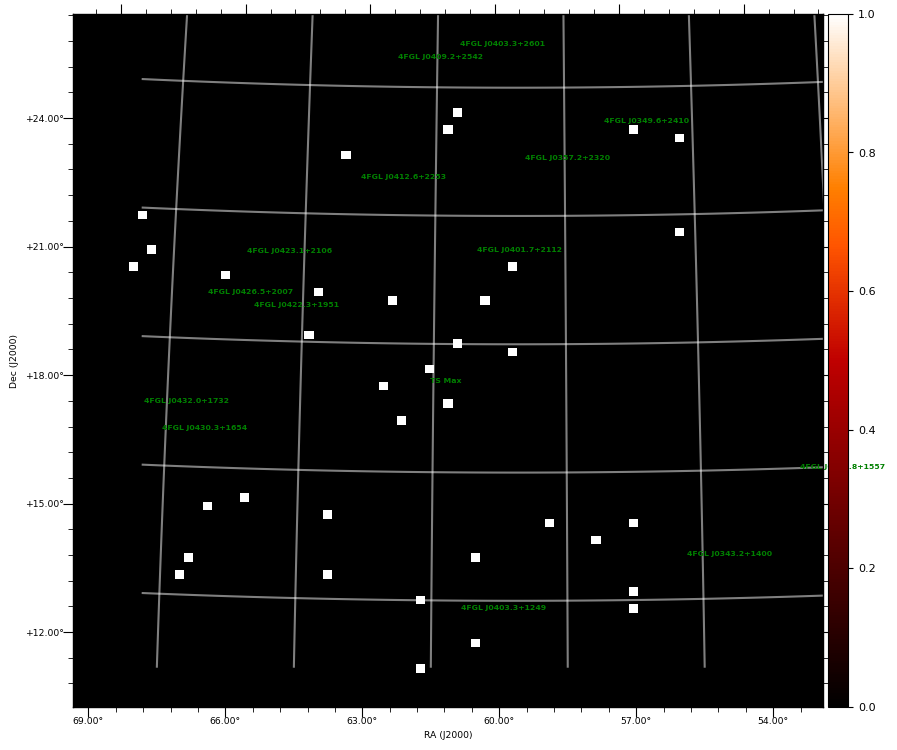
TS = 6.0 |
Ra | 61.54° |
| Dec | 18.14° |
| Nearby 4FGL sources | 0 |
| Sun in this pixel? | False |
| Moon in this pixel? | False |
|
|
TS MAP |
COUNT MAP |
|
|
|
| TS MAXIMUM |
|---|
|
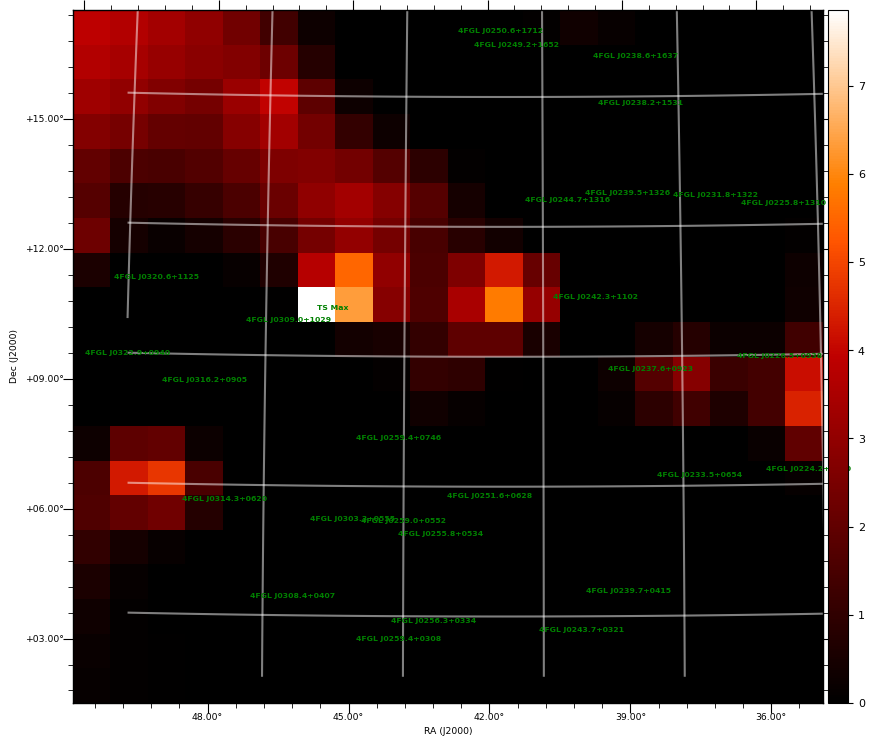
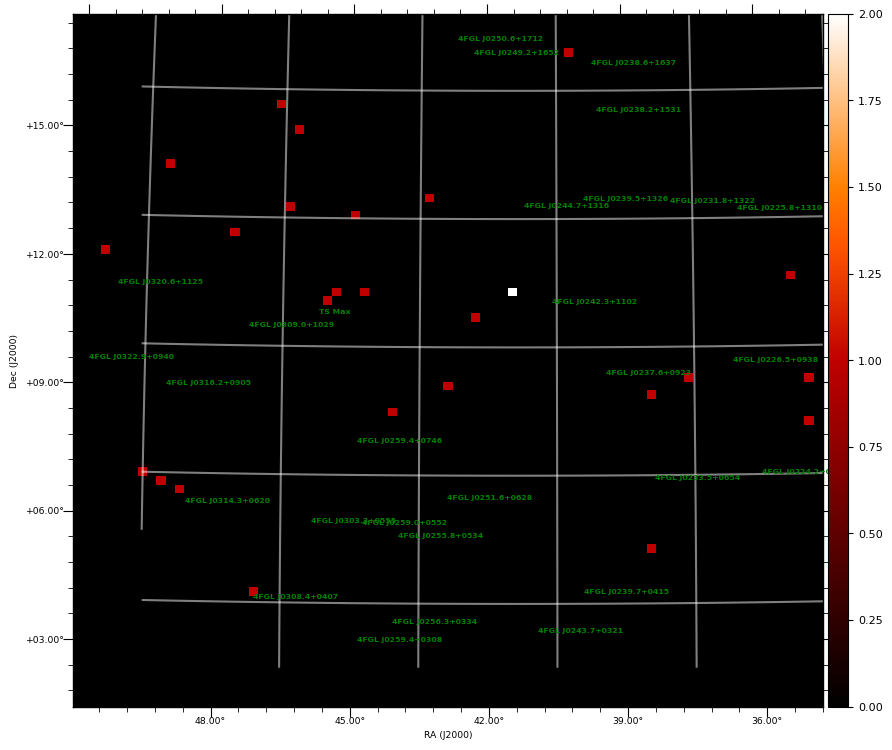
TS = 7.9 |
Ra | 45.73° |
| Dec | 10.8° |
| Nearby 4FGL sources | 0 |
| Sun in this pixel? | False |
| Moon in this pixel? | False |
|
|
TS MAP |
COUNT MAP |
|
|
|
| TS MAXIMUM |
|---|
|
TS = 17.1 |
Ra | 122.19° |
| Dec | -29.01° |
| Nearby 4FGL sources | 0 |
| Sun in this pixel? | False |
| Moon in this pixel? | False |
|
|
TS MAP |
COUNT MAP |
|
|
|
|
|