| GWFUP ANALYSIS REPORT FOR GW S230805x |
|
|
|
| SUMMARY | |
| Name | S230805x |
| Trigger MET | 712899774.96 |
| Date | 2023-08-05 |
| Time | 03:42:49 |
| In SAA? | False |
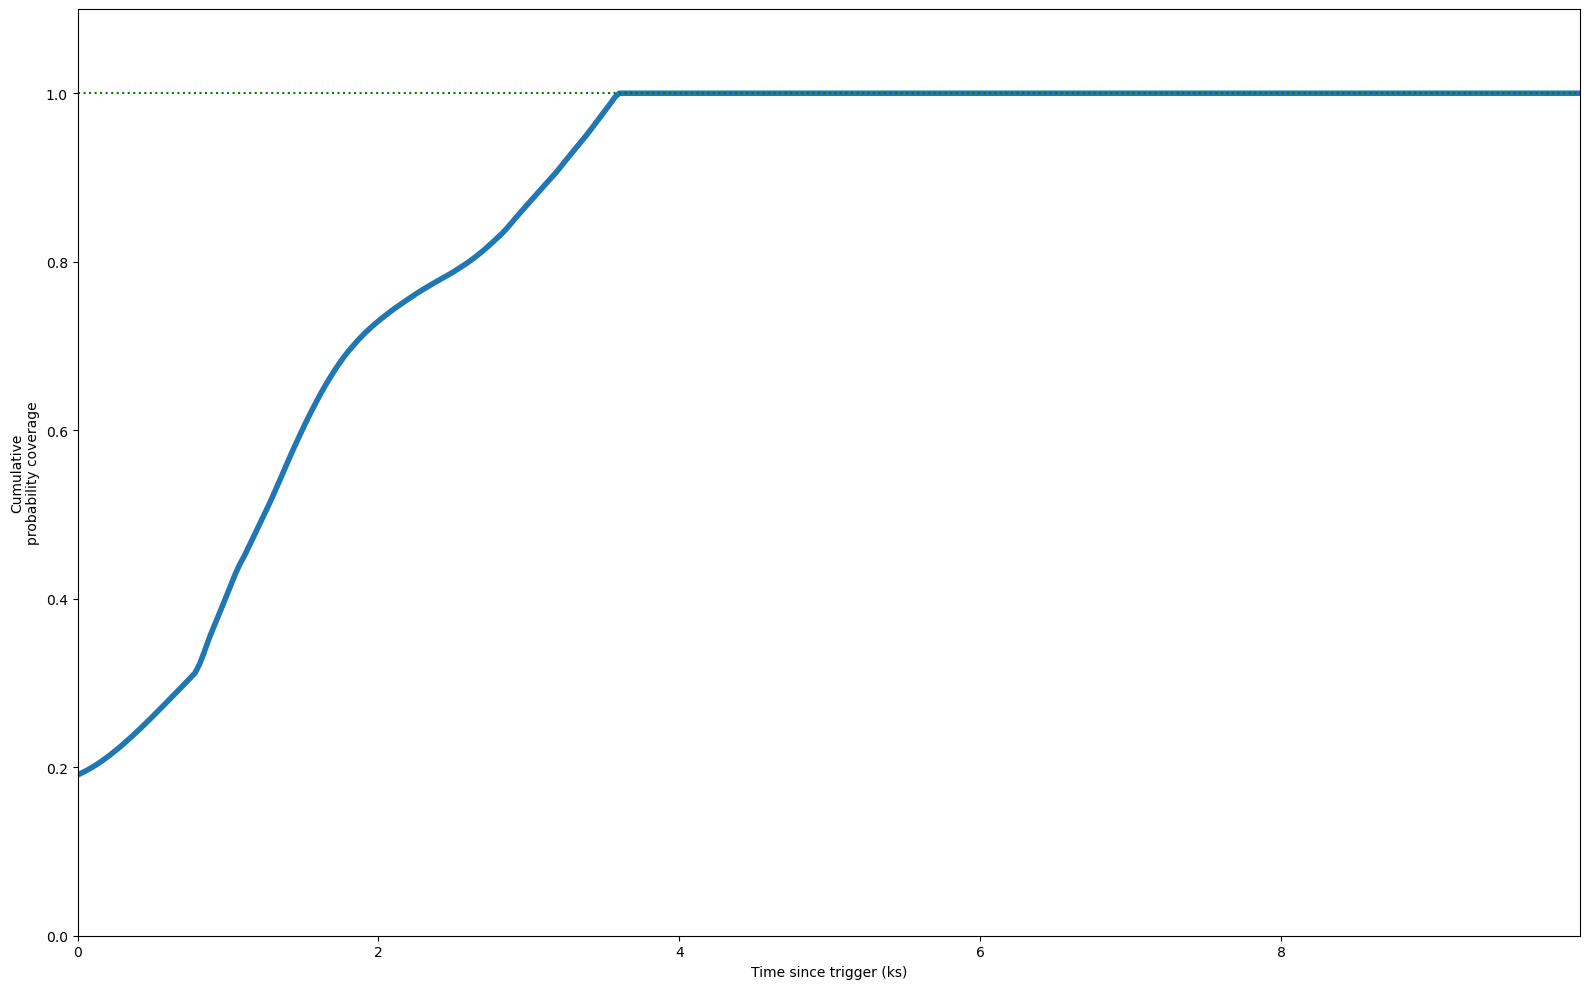
| Inst Coverage | 19.1% |
| T Max Coverage | 3.6 ks (100.0%) |
| E Min | 100.0 MeV |
| E Max | 100000.0 MeV |
| T Start | 0.0 s |
| T Stop | 10000.0 s |
| Theta Max | 65.0° |
| Z Max | 100.0° |
| ROI | 8.0° |
| IRF | p8_source |
| Galactic Model | template |
| Strategy | time |
| Particle Model | isotr template |
| NSide | 64 |
| Version | v02 |
|
| COVERAGE |
|
|
| FIXED TIME INTERVAL ANALYSIS |
|
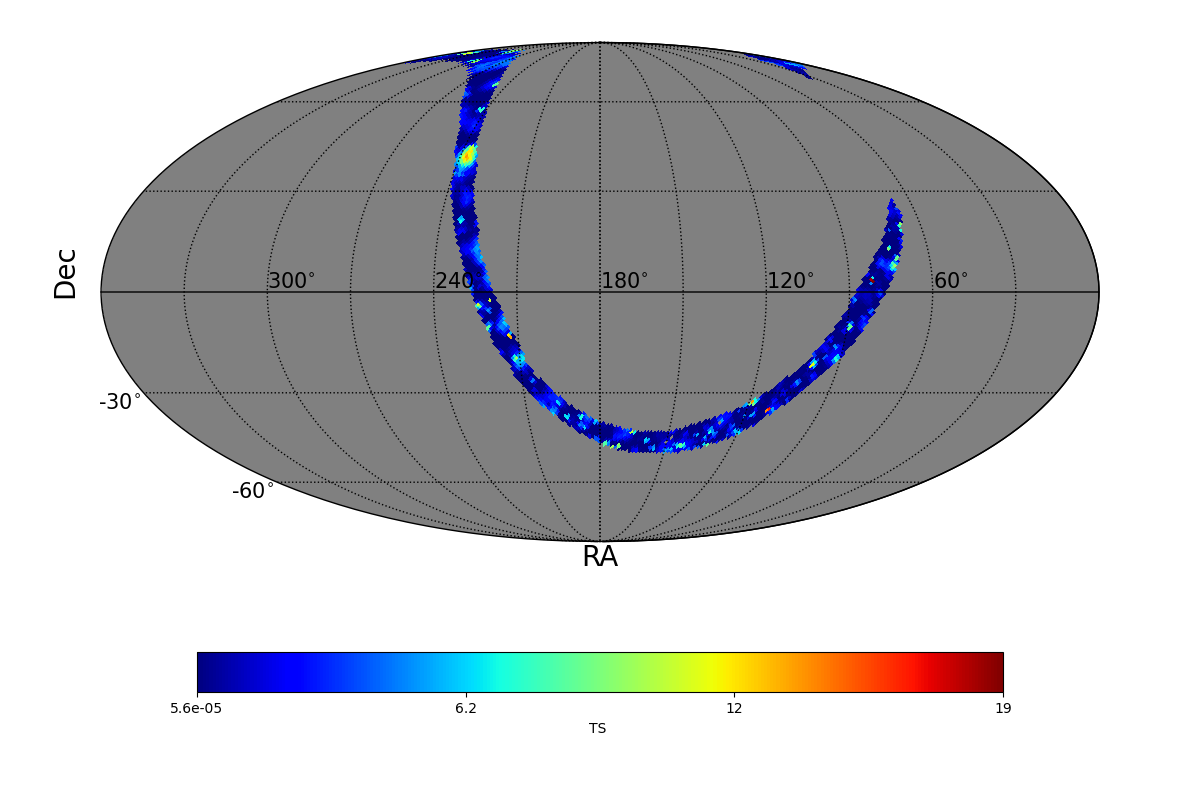
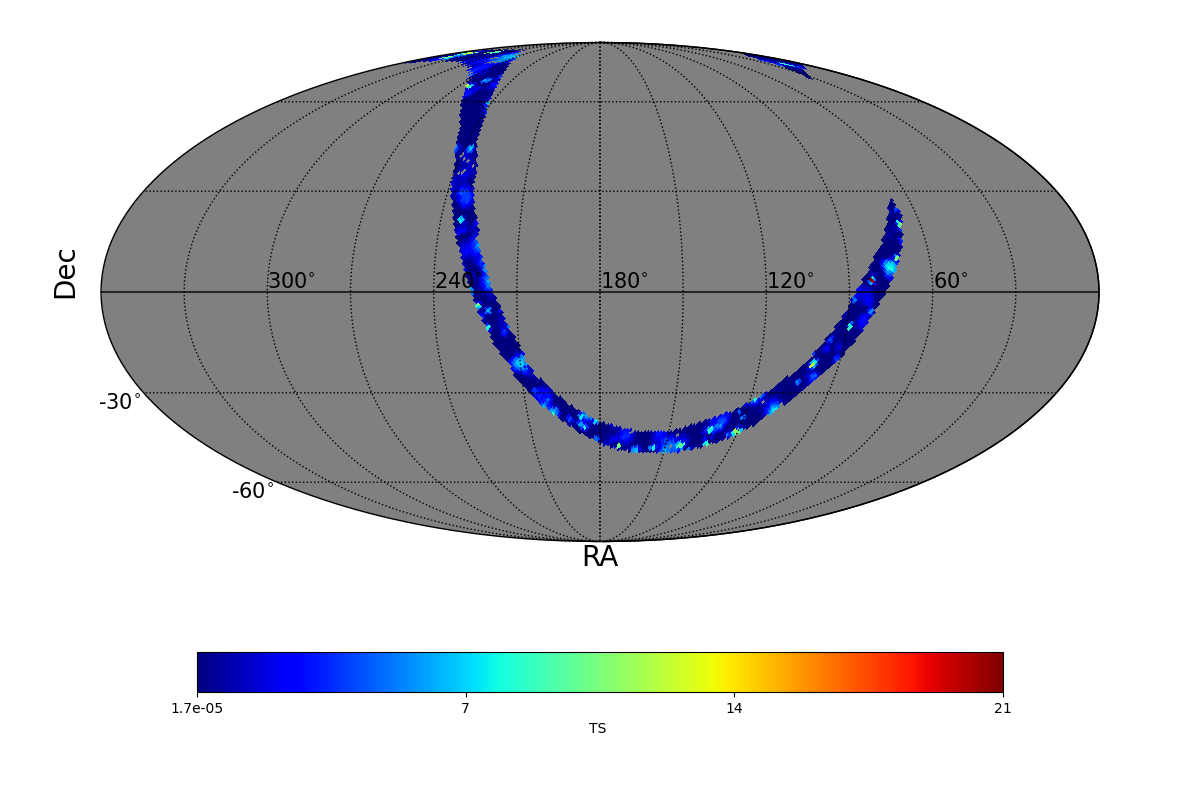
| TS MAXIMUM |
|---|
|
TS = 18.6 |
Ra | 81.56° |
| Dec | 2.99° |
| Nearby 4FGL sources | 0 |
| Sun in this pixel? | False |
| Moon in this pixel? | False |
| LIST OF OTHER TS > 25.0 |
|---|
|
| TS MAP |
|
|
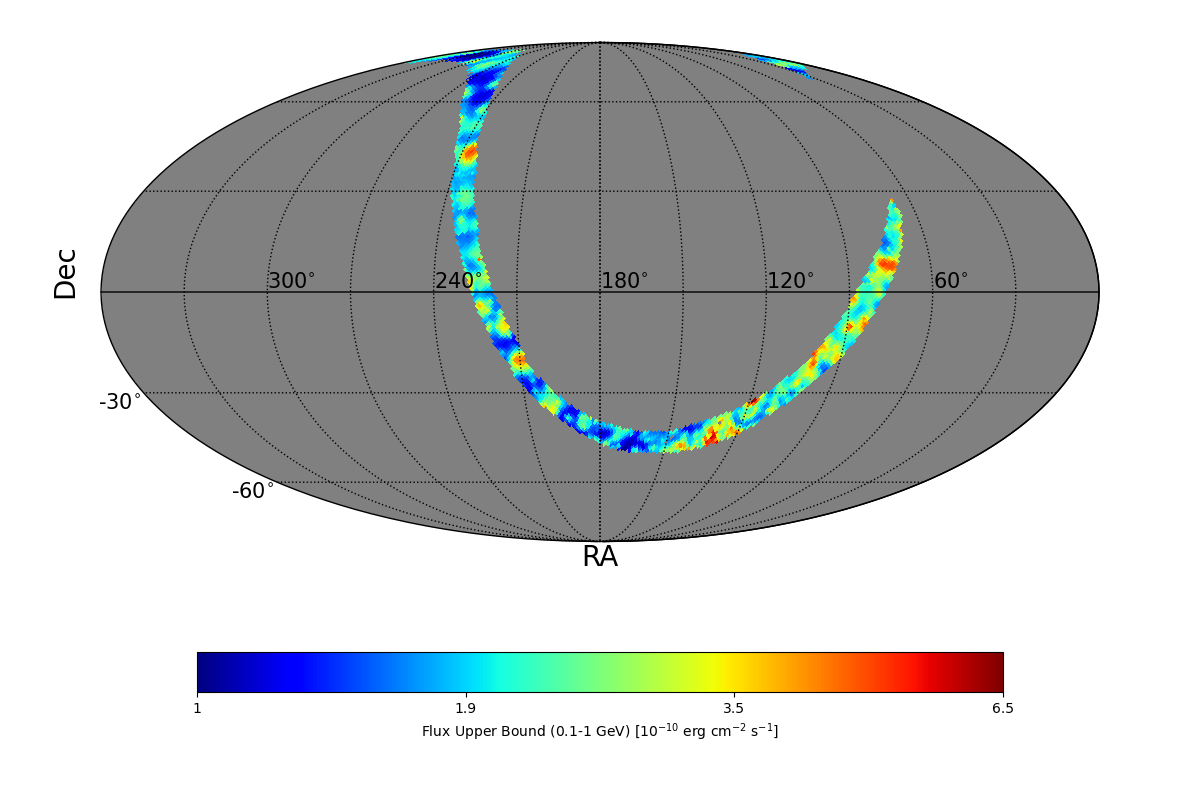
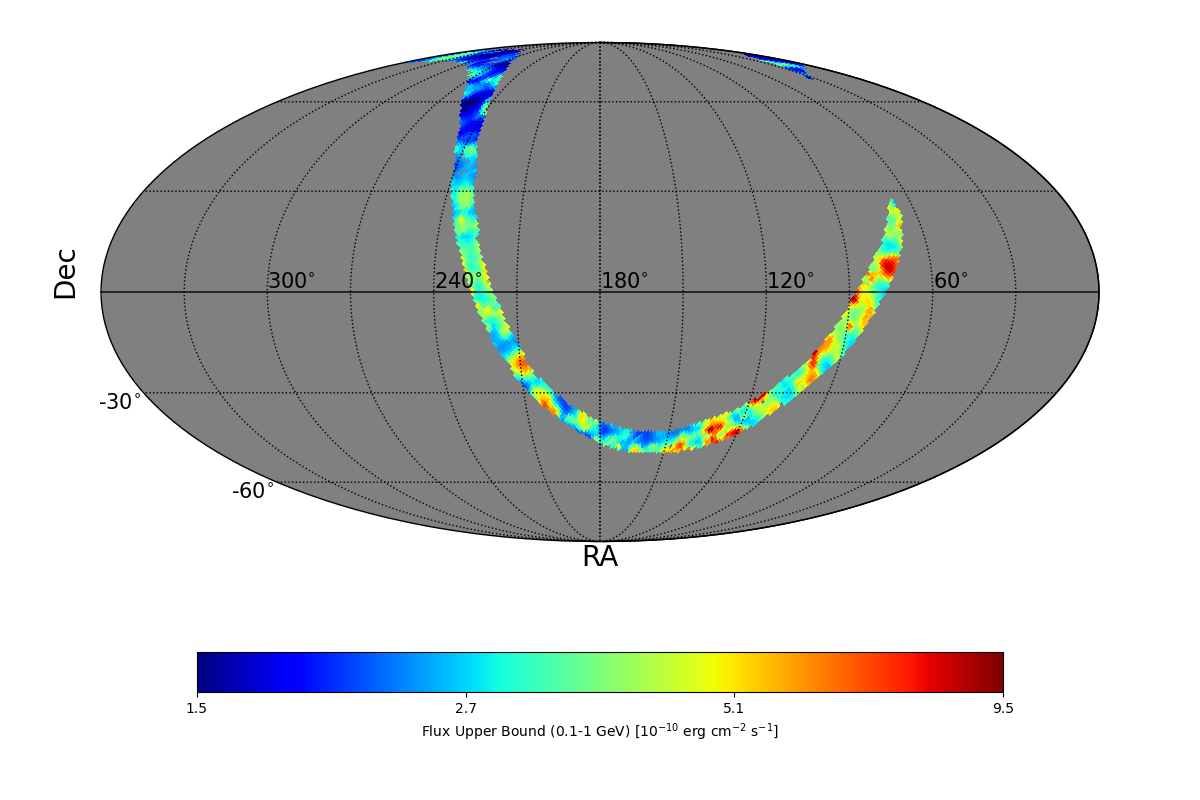
| FLUX UB EXTREMES |
| UB min | 1.03 e-10 erg cm-2 s-1 |
| UB max | 0.6 e-9 erg cm-2 s-1 |
| BAYESIAN FLUX UB (CL=95%) |
| Photon flux | 10.66 e-7 ph cm-2 s-1 |
| Energy flux | 3.55 e-10 erg cm-2 s-1 |
|
| UL MAP |
|
|
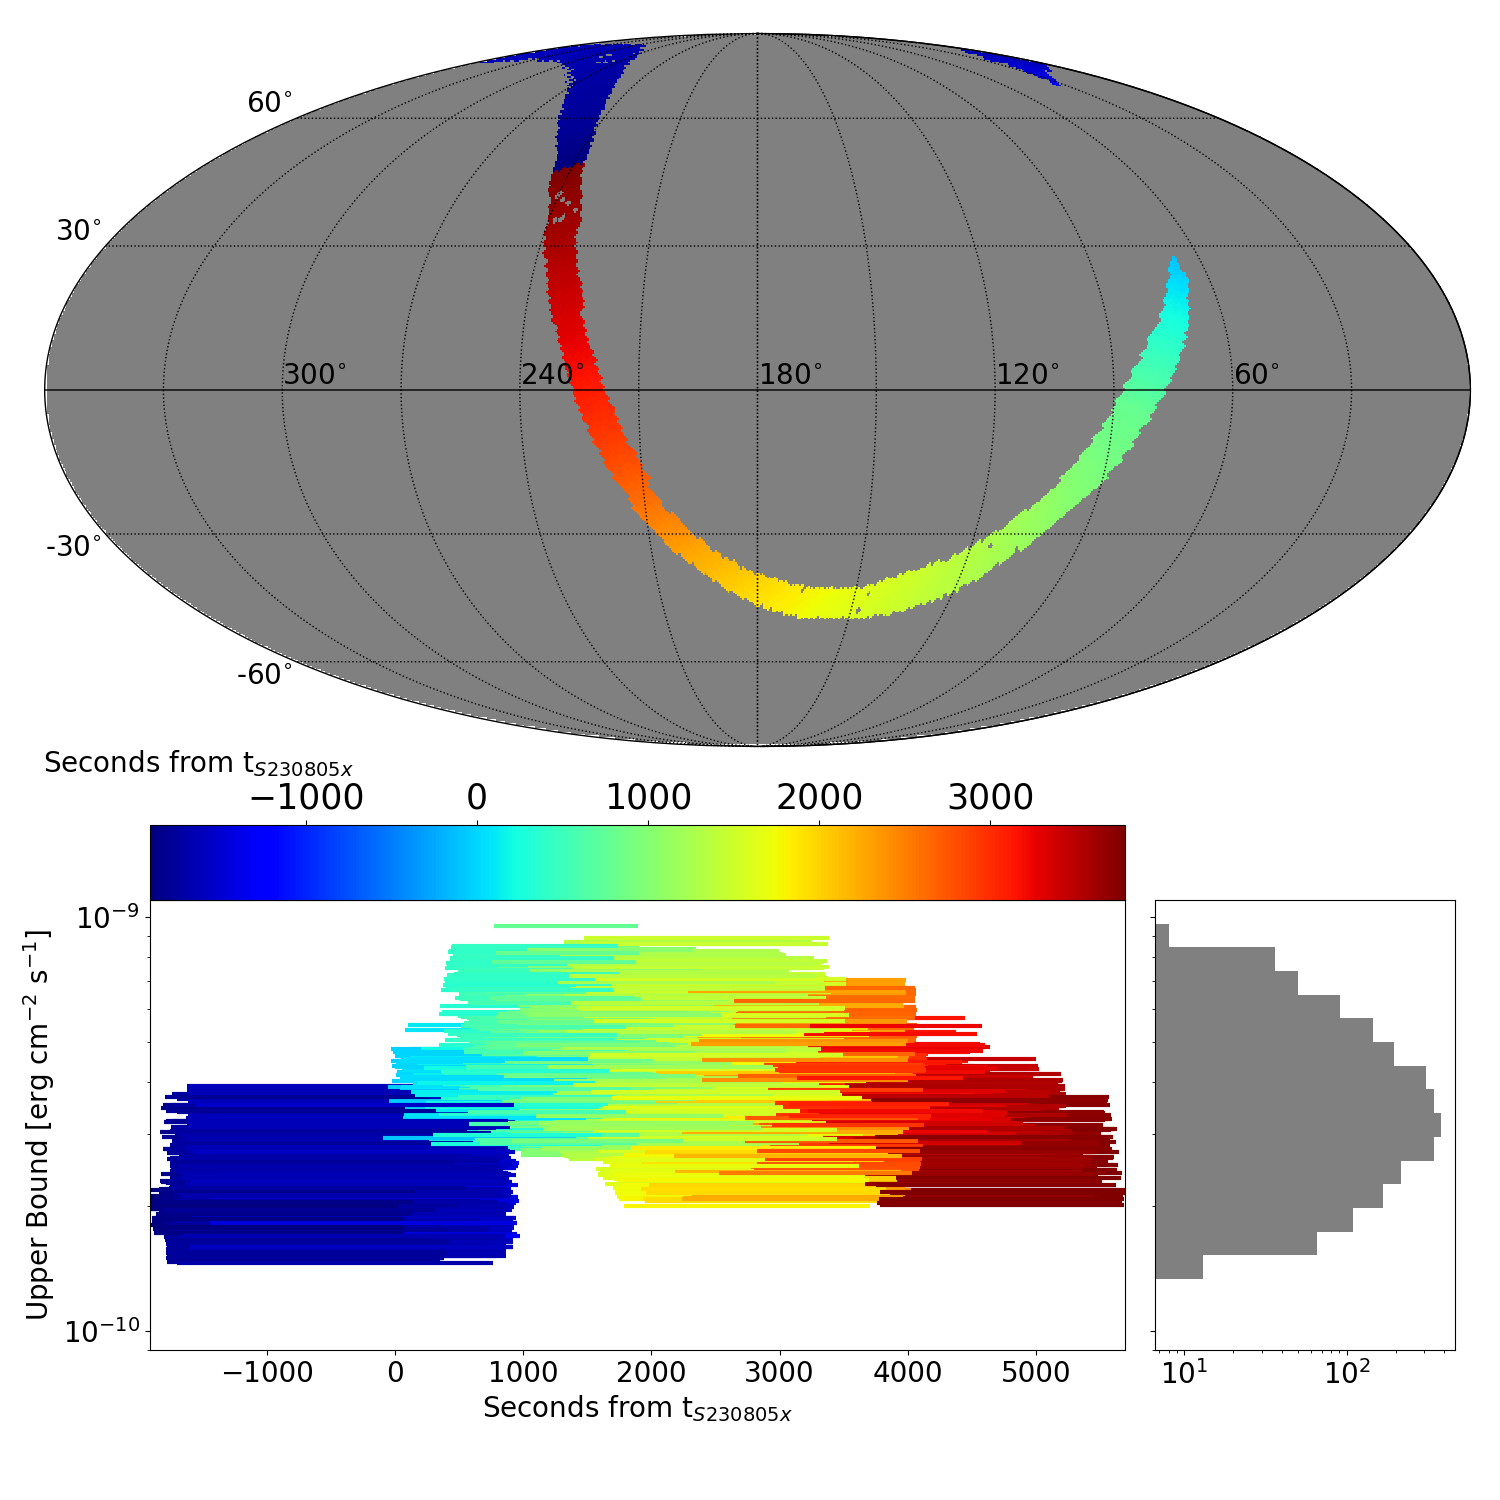
| ADAPTIVE TIME INTERVAL ANALYSIS |
|
|
|
DISTRIBUTION OF THE UPPER BOUNDS |
|
|
| TS MAXIMUM |
|---|
|
TS = 21.0 |
Ra | 82.27° |
| Dec | 3.58° |
| Nearby 4FGL sources | 0 |
| Sun in this pixel? | False |
| Moon in this pixel? | False |
| LIST OF OTHER TS > 25.0 |
|---|
|
|
TS MAP |
|
|
| FLUX UB EXTREMES |
| UB min | 1.46 e-10 erg cm-2 s-1 |
| UB max | 1.0 e-9 erg cm-2 s-1 |
|
|
UL MAP |
|
|
|
|
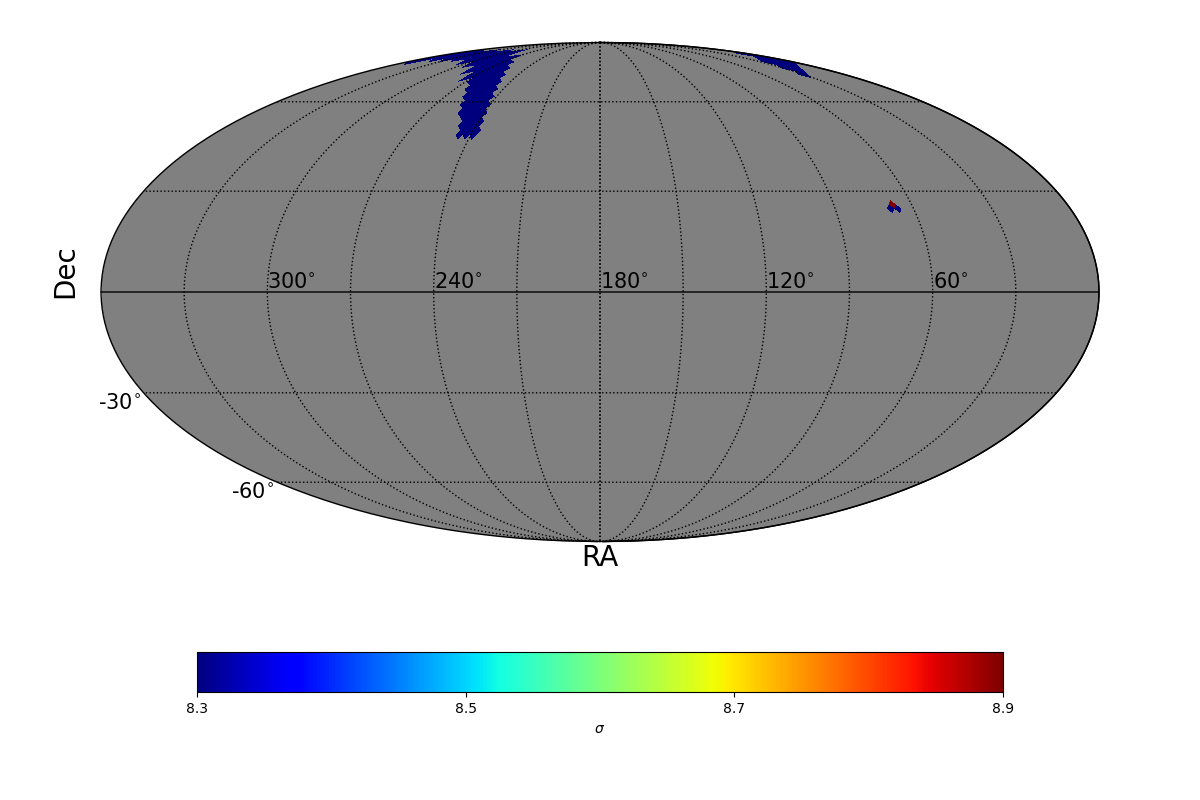
| SIGMA MAXIMUM |
|---|
|
SIGMA = 8.9 |
Ra | 67.5° |
| Dec | 25.94° |
| Nearby 4FGL sources | 0 |
| Sun in this pixel? | False |
| Moon in this pixel? | False |
| LIST OF OTHER SIGMA > 4 |
|---|
| SIGMA = 8.3 |
Ra | 66.09° |
| Dec | 24.62° |
|
|
SIGMA MAP |
|
|
|
|
|
|
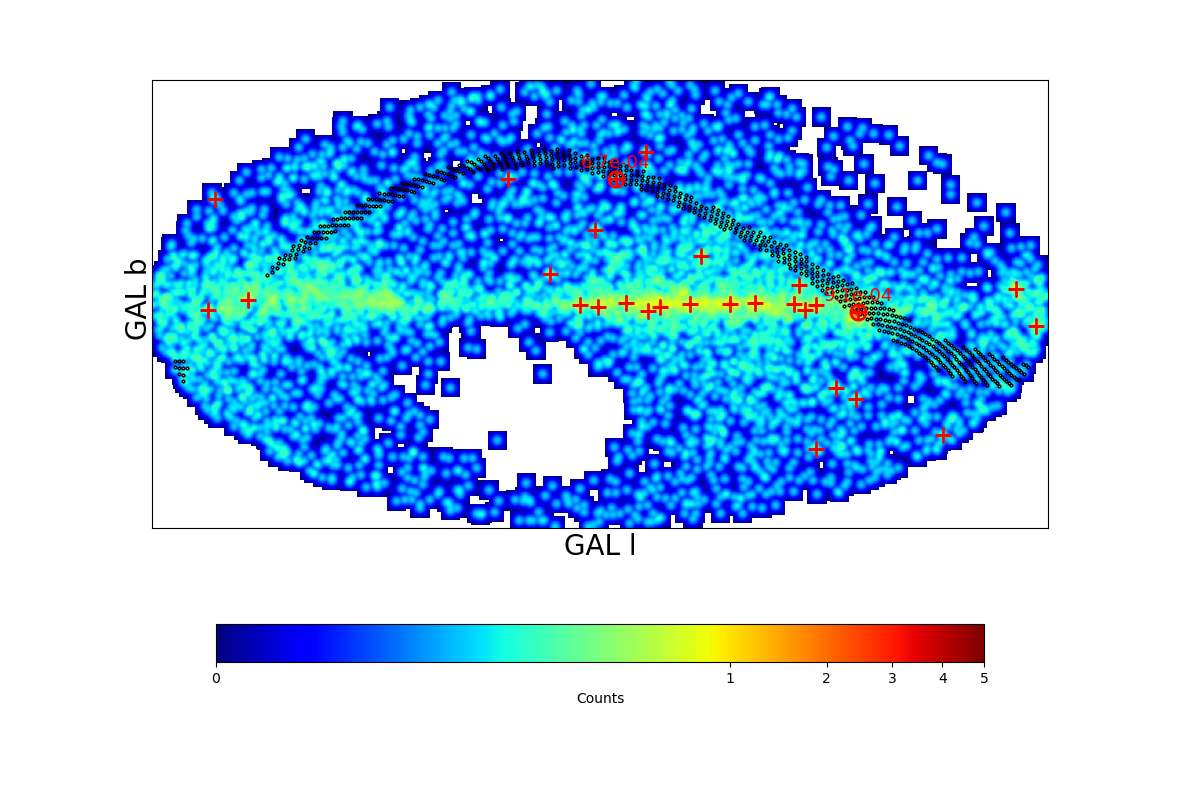
COUNT MAP |
|
|
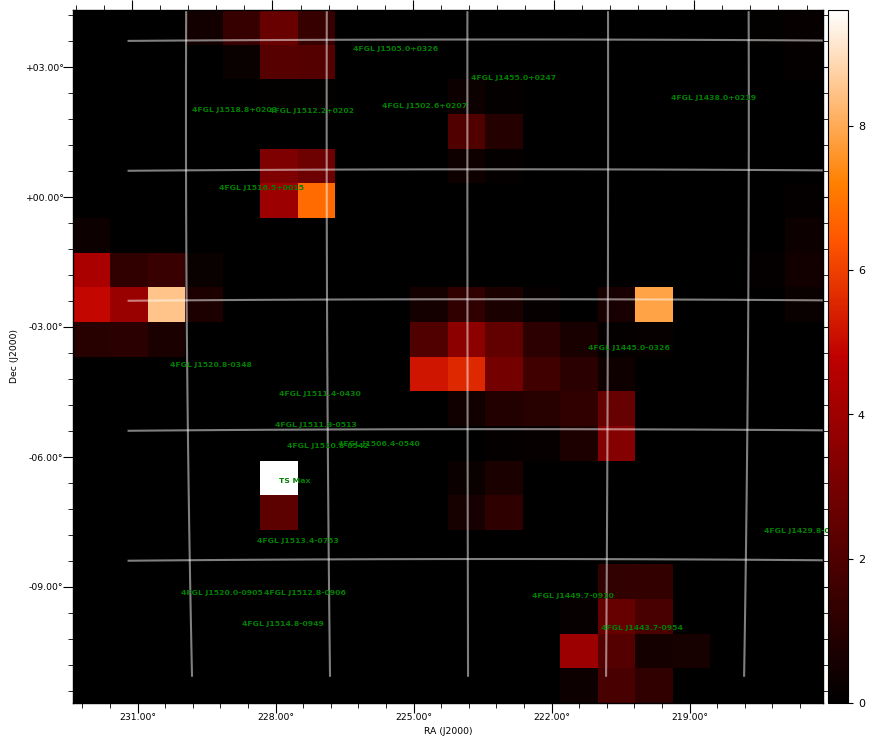
| TS MAXIMUM |
|---|
|
TS = 9.6 |
Ra | 227.87° |
| Dec | -6.51° |
| Nearby 4FGL sources | 1 |
| 4FGL J1510.8-0542 | Δ=0.82° |
| Sun in this pixel? | False |
| Moon in this pixel? | False |
|
|
TS MAP |
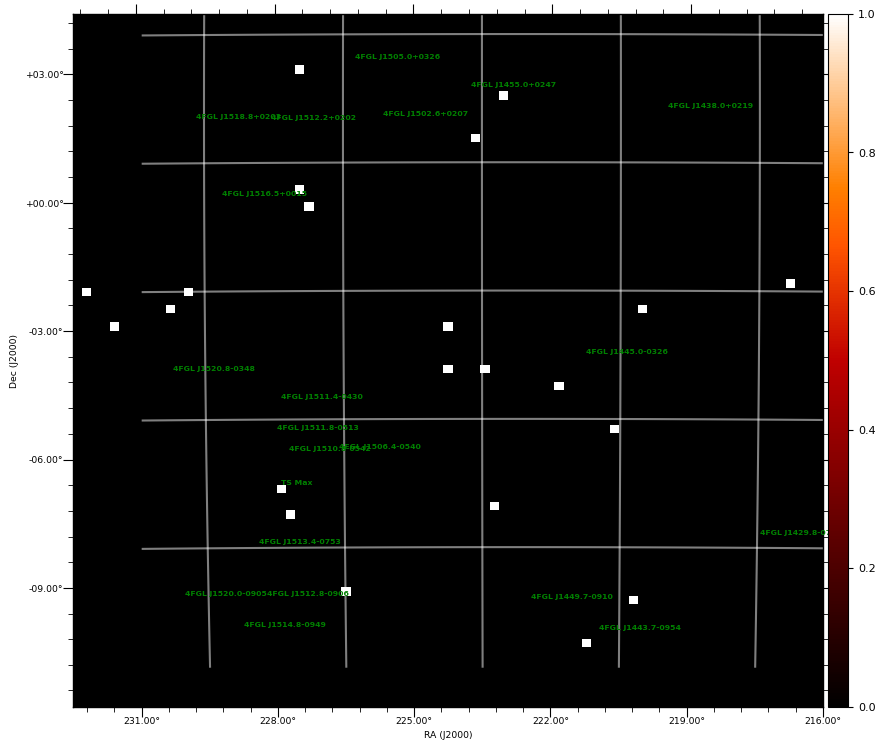
COUNT MAP |
|
|
|
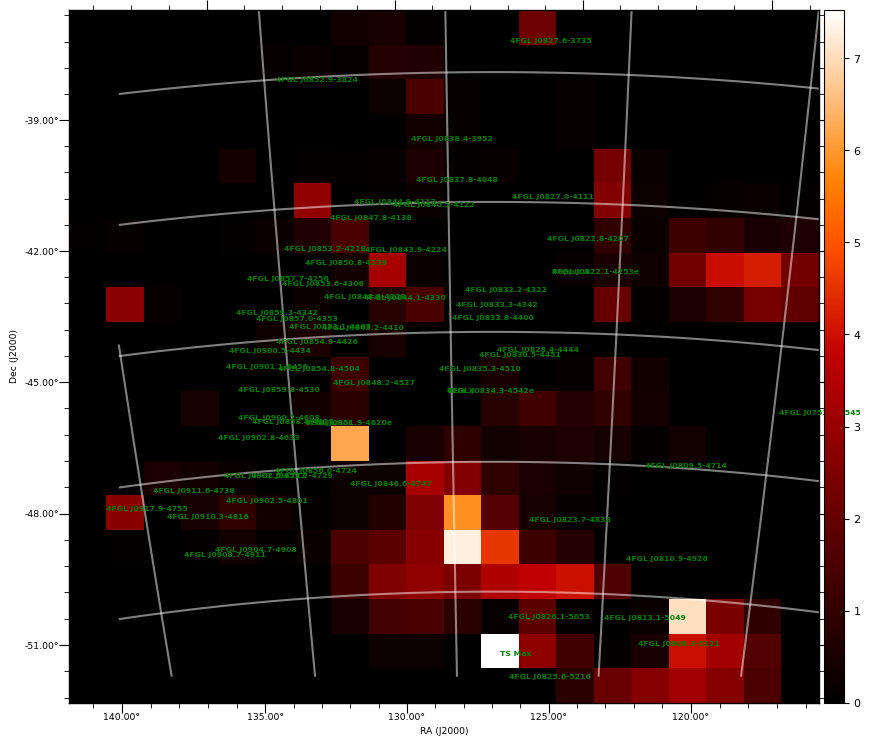
| TS MAXIMUM |
|---|
|
TS = 7.5 |
Ra | 126.76° |
| Dec | -51.75° |
| Nearby 4FGL sources | 2 |
| 4FGL J0825.6-5216 | Δ=0.56° |
| 4FGL J0826.1-5053 | Δ=0.86° |
| Sun in this pixel? | False |
| Moon in this pixel? | False |
|
|
TS MAP |
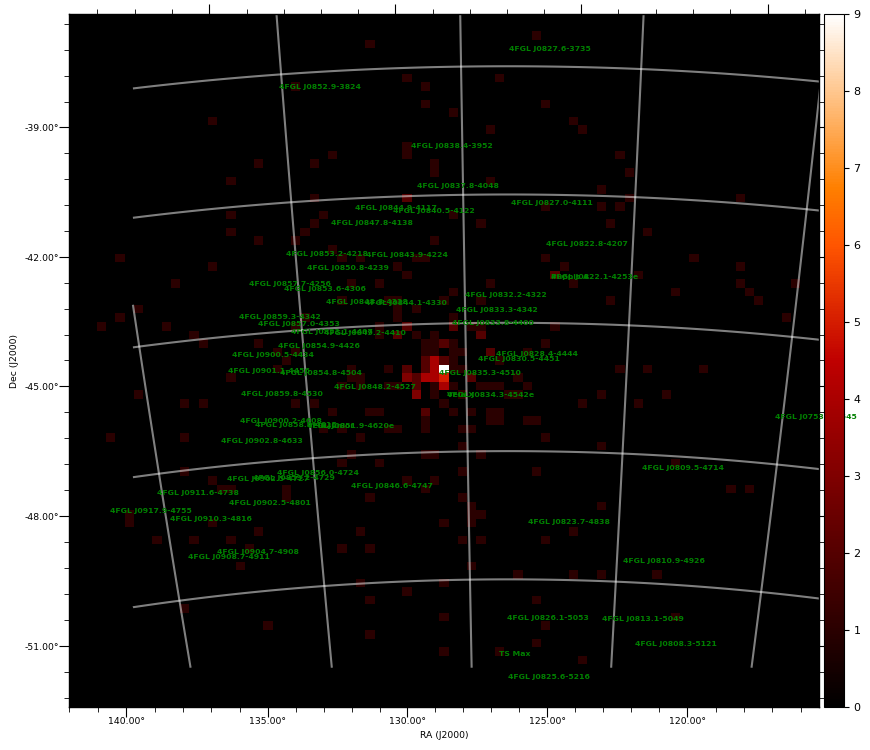
COUNT MAP |
|
|
|
|
|