| GWFUP ANALYSIS REPORT FOR GW S230630am |
|
|
|
| SUMMARY | |
| Name | S230630am |
| Trigger MET | 709822691.89 |
| Date | 2023-06-30 |
| Time | 12:58:06 |
| In SAA? | True |
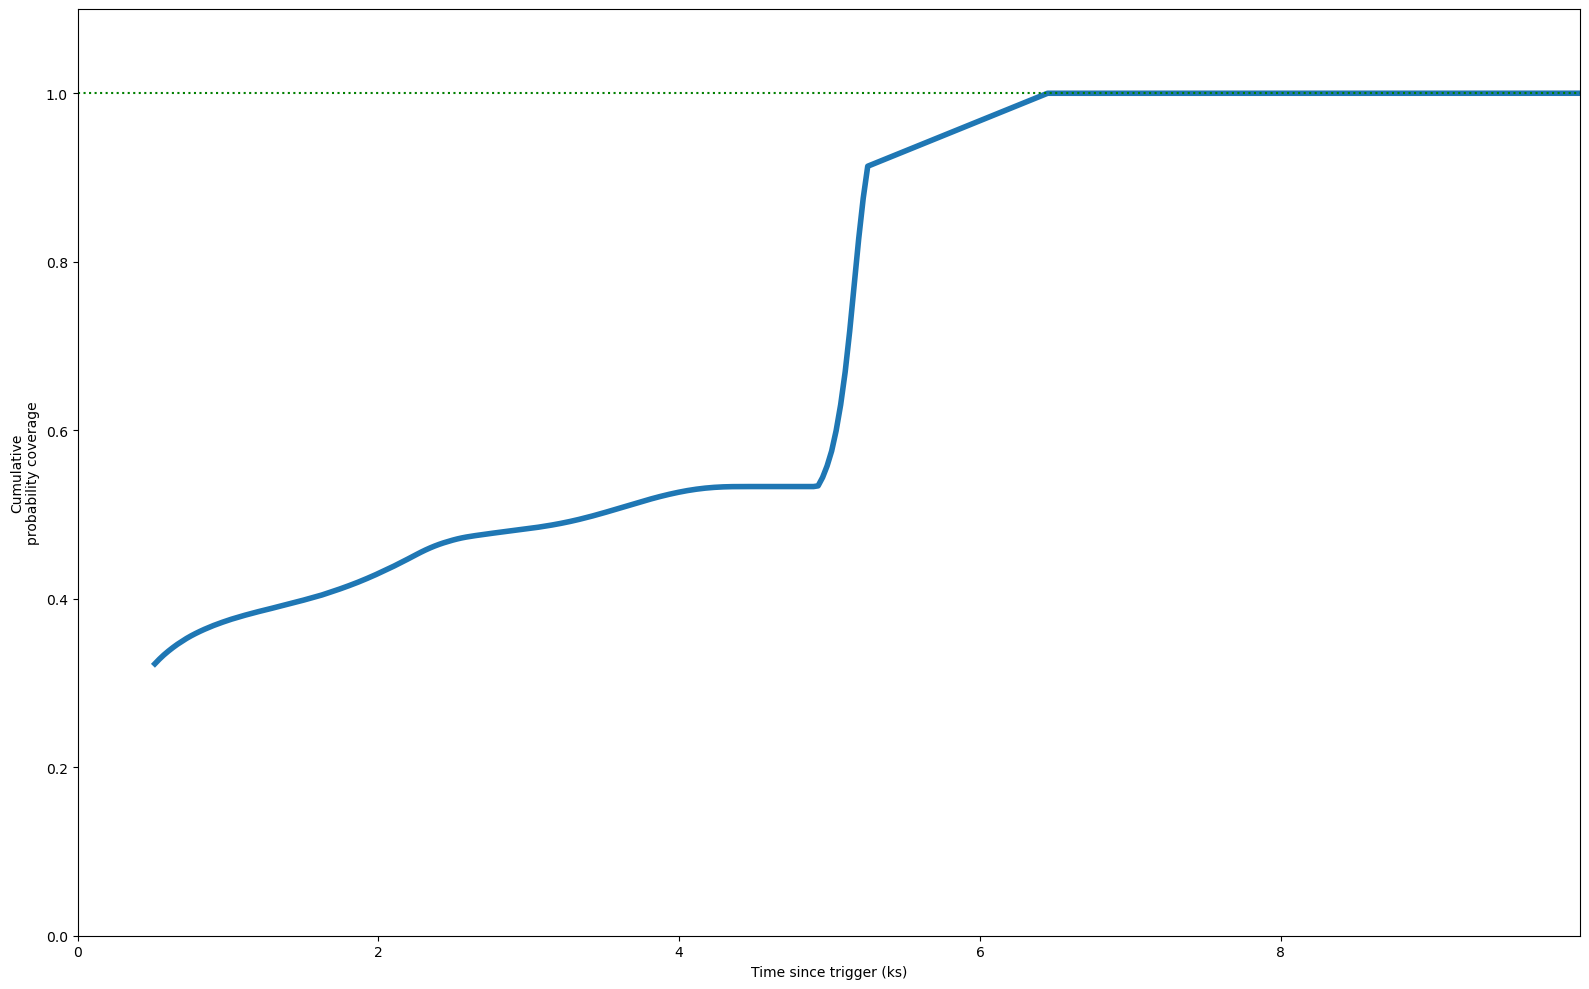
| Inst Coverage | 32.3% (0.5 ks) |
| T Max Coverage | 8.8 ks (100.0%) |
| E Min | 100.0 MeV |
| E Max | 100000.0 MeV |
| T Start | 0.0 s |
| T Stop | 10000.0 s |
| Theta Max | 65.0° |
| Z Max | 100.0° |
| ROI | 8.0° |
| IRF | p8_source |
| Galactic Model | template |
| Strategy | time |
| Particle Model | isotr template |
| NSide | 64 |
| Version | v02 |
|
| COVERAGE |
|
|
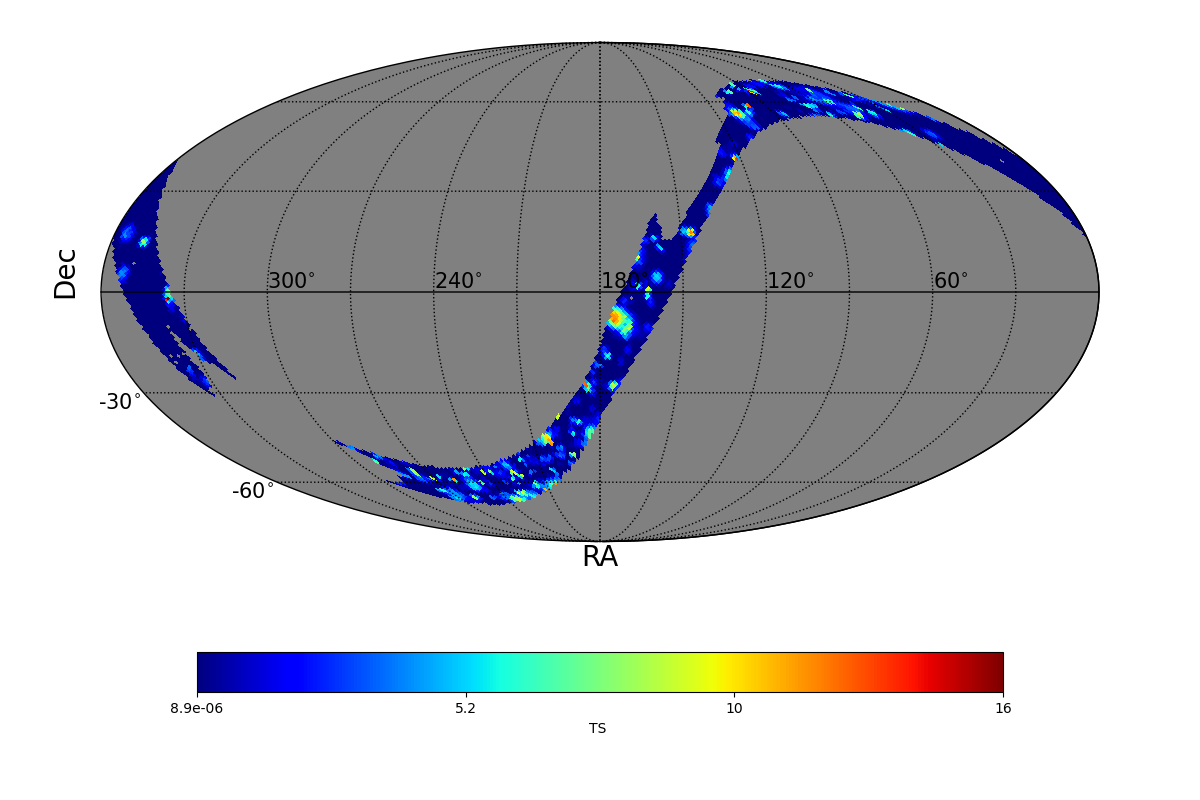
| FIXED TIME INTERVAL ANALYSIS |
|
| TS MAXIMUM |
|---|
|
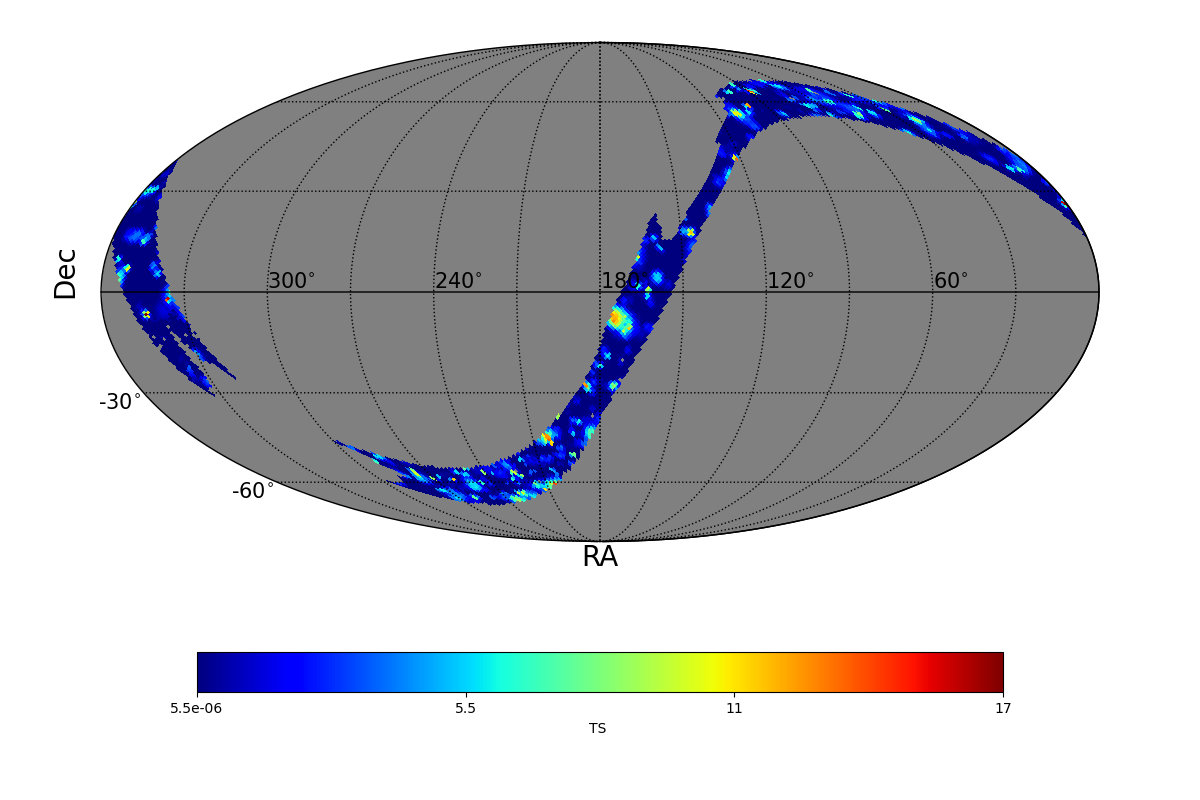
TS = 16.6 |
Ra | 344.53° |
| Dec | -6.58° |
| Nearby 4FGL sources | 0 |
| Sun in this pixel? | False |
| Moon in this pixel? | False |
| LIST OF OTHER TS > 25.0 |
|---|
|
| TS MAP |
|
|
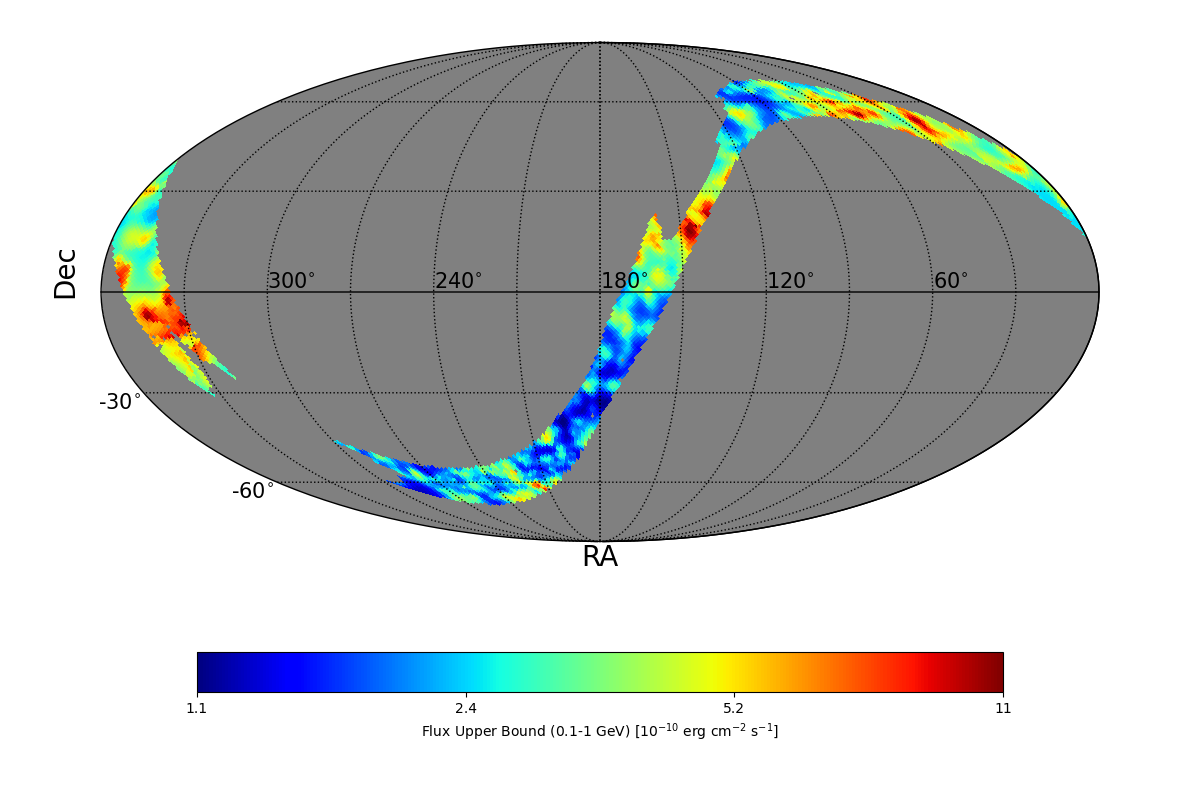
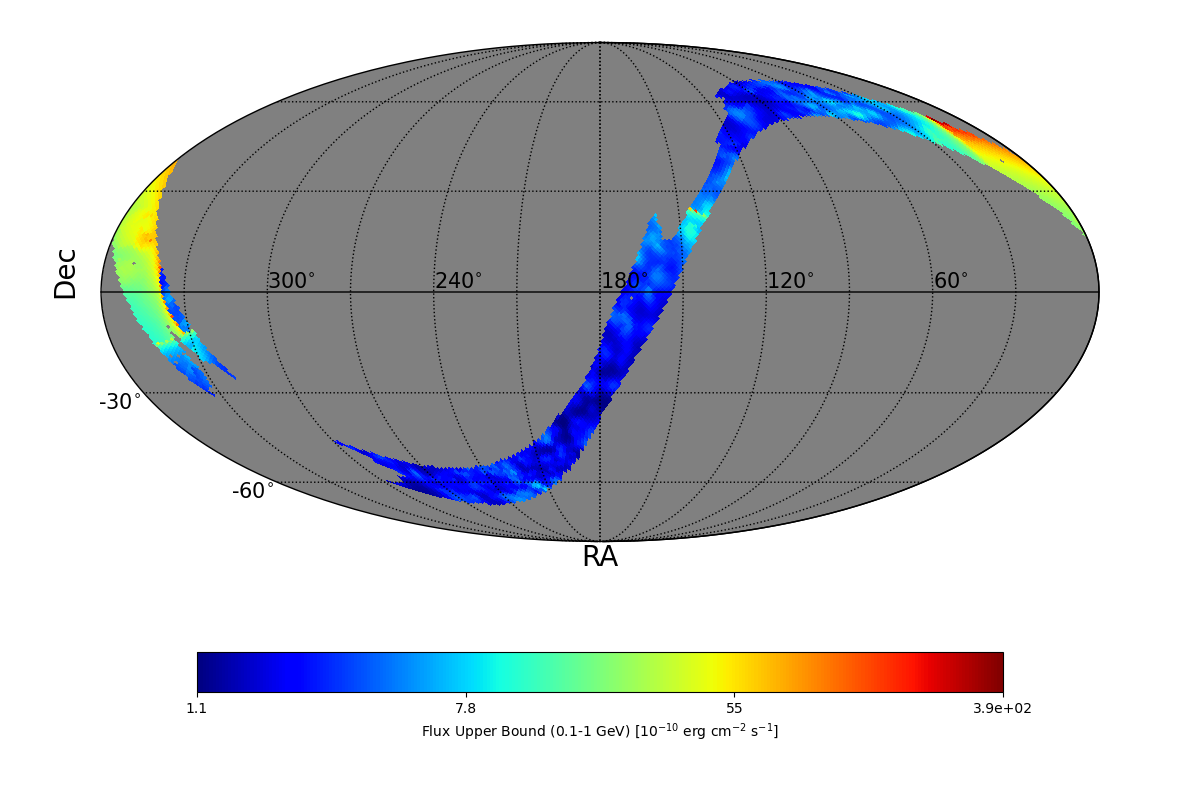
| FLUX UB EXTREMES |
| UB min | 1.09 e-10 erg cm-2 s-1 |
| UB max | 1.1 e-9 erg cm-2 s-1 |
| BAYESIAN FLUX UB (CL=95%) |
| Photon flux | 14.84 e-7 ph cm-2 s-1 |
| Energy flux | 6.39 e-10 erg cm-2 s-1 |
|
| UL MAP |
|
|
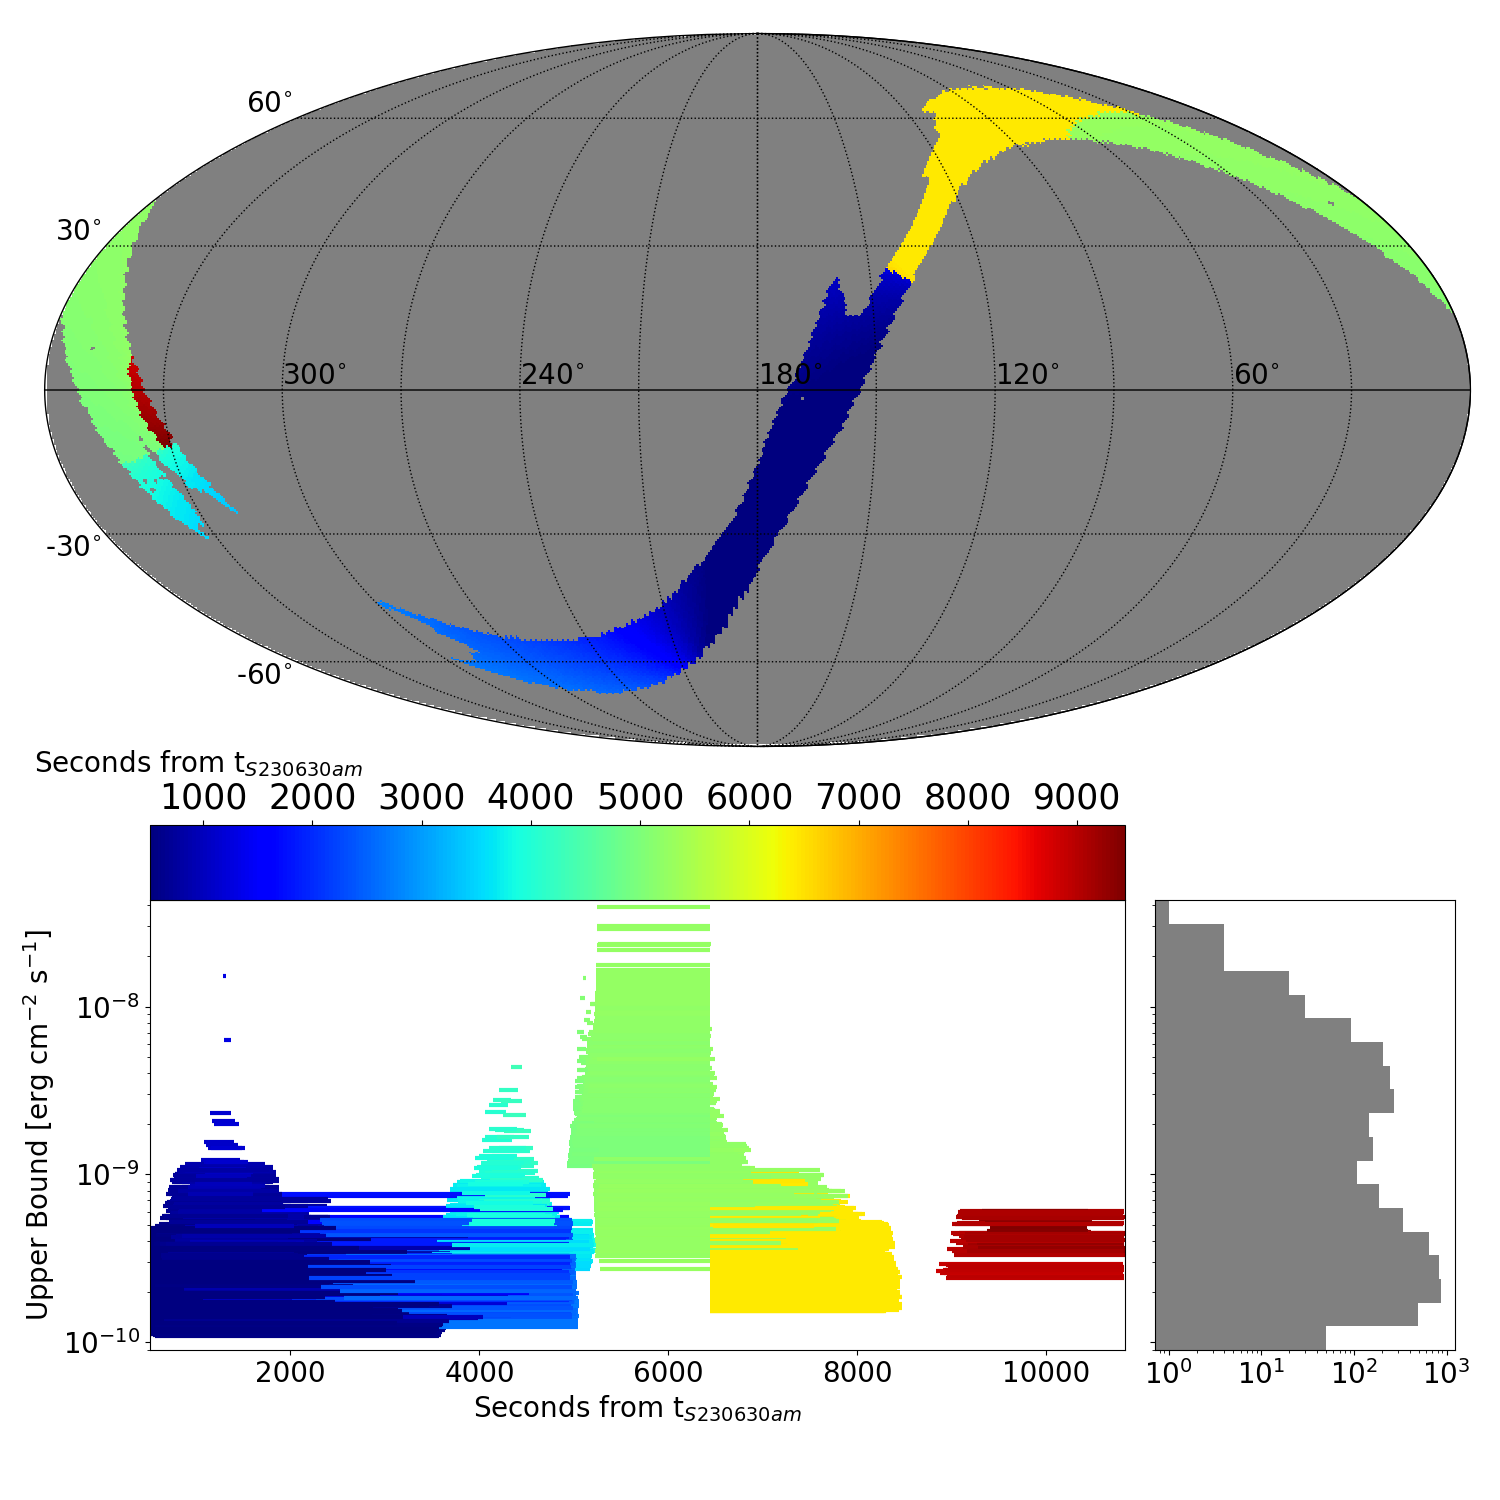
| ADAPTIVE TIME INTERVAL ANALYSIS |
|
|
|
DISTRIBUTION OF THE UPPER BOUNDS |
|
|
| TS MAXIMUM |
|---|
|
TS = 15.5 |
Ra | 336.09° |
| Dec | -1.79° |
| Nearby 4FGL sources | 0 |
| Sun in this pixel? | False |
| Moon in this pixel? | False |
| LIST OF OTHER TS > 25.0 |
|---|
|
|
TS MAP |
|
|
| FLUX UB EXTREMES |
| UB min | 1.09 e-10 erg cm-2 s-1 |
| UB max | 39.2 e-9 erg cm-2 s-1 |
|
|
UL MAP |
|
|
|
|
|
|
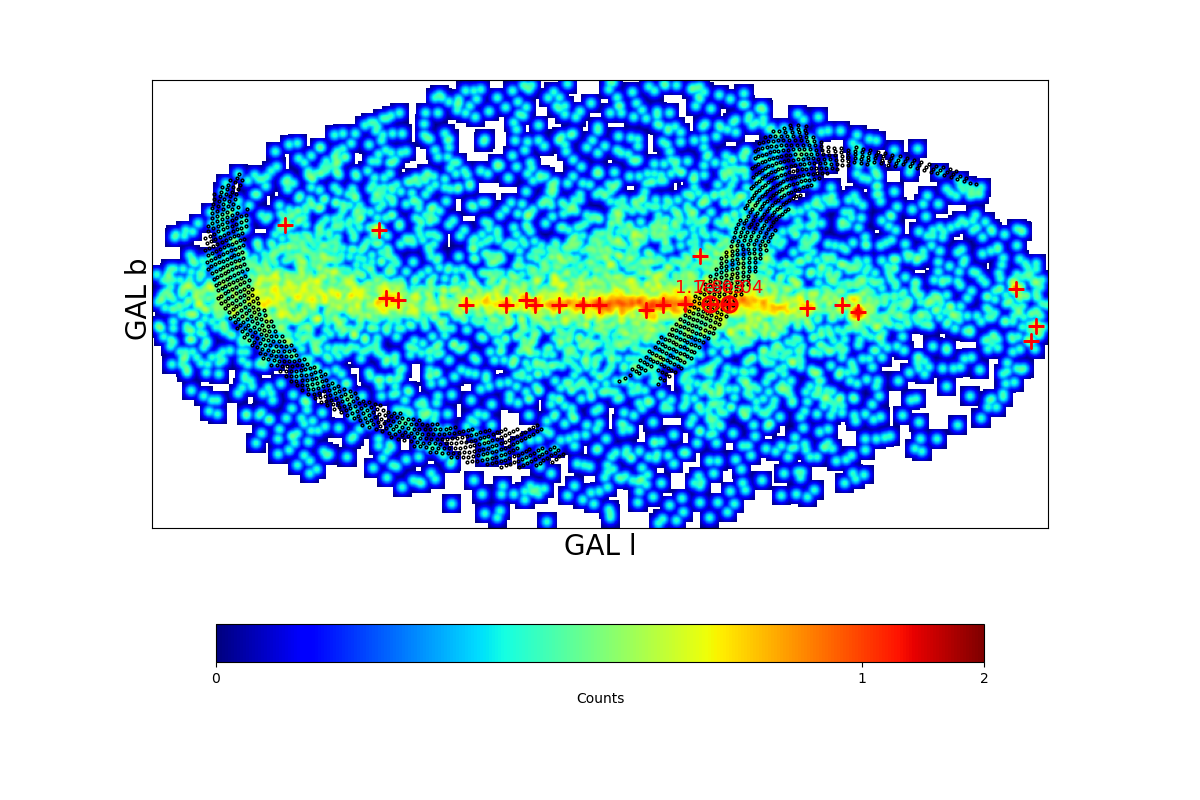
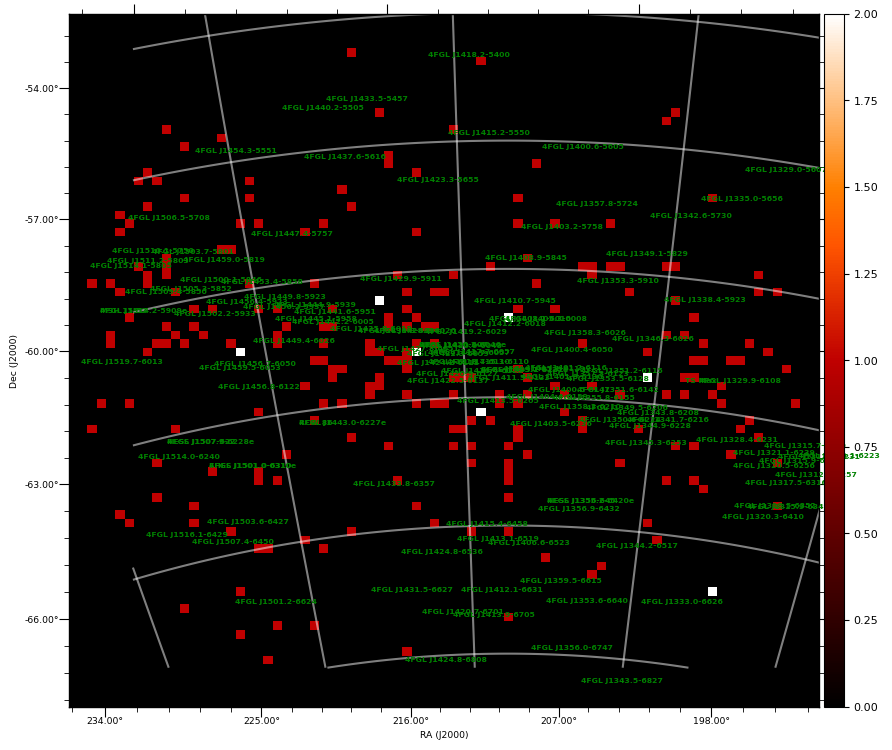
COUNT MAP |
|
|
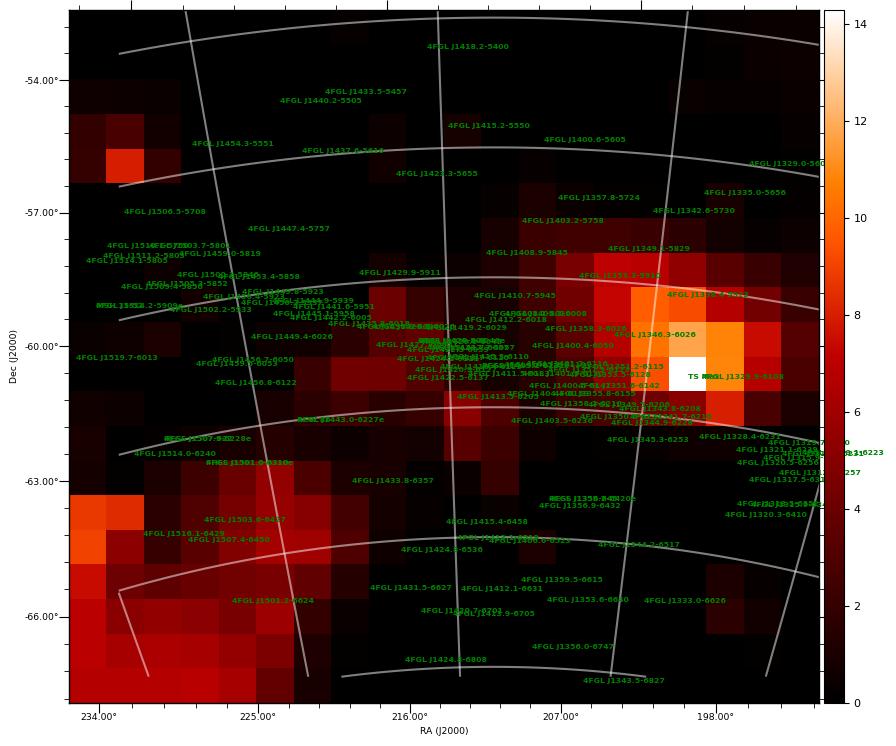
| TS MAXIMUM |
|---|
|
TS = 14.3 |
Ra | 203.14° |
| Dec | -61.19° |
| Nearby 4FGL sources | 1 |
| 4FGL J1329.9-6108 | Δ=0.32° |
| Sun in this pixel? | False |
| Moon in this pixel? | False |
|
|
TS MAP |
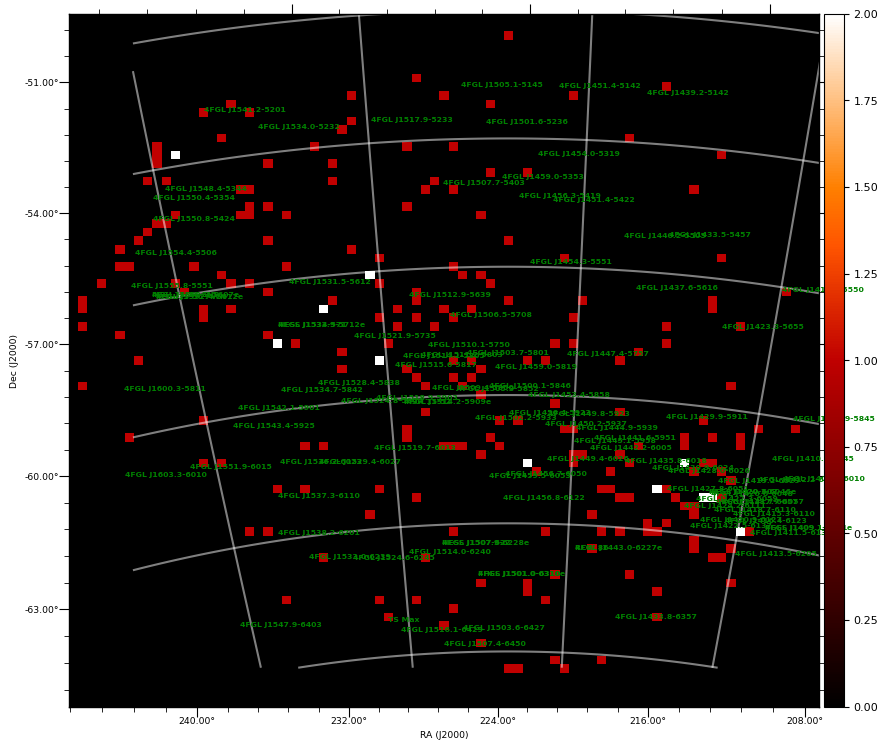
COUNT MAP |
|
|
|
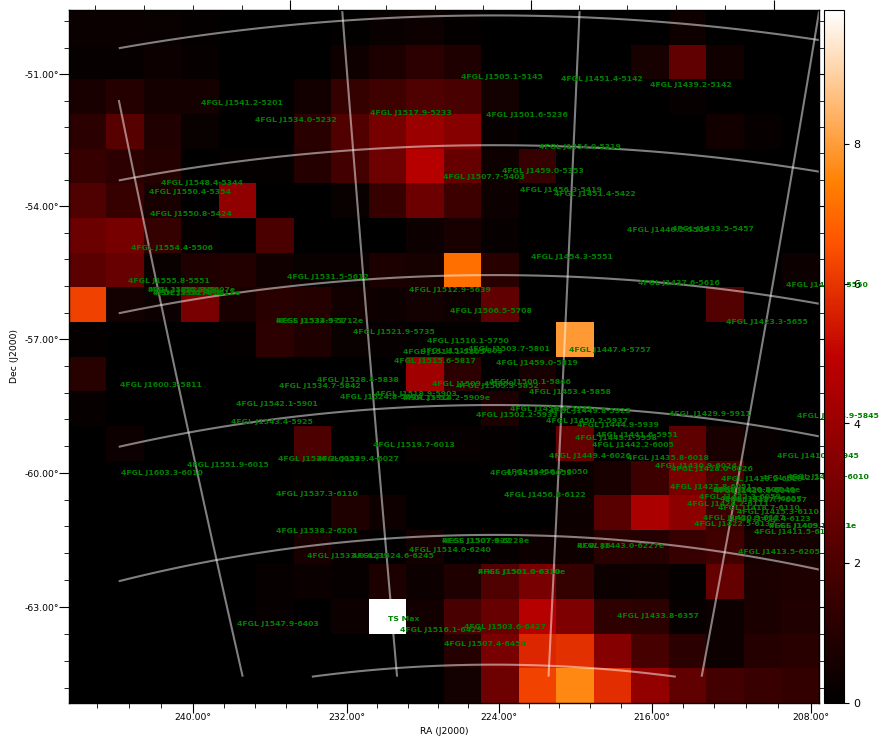
| TS MAXIMUM |
|---|
|
TS = 9.9 |
Ra | 229.65° |
| Dec | -64.25° |
| Nearby 4FGL sources | 1 |
| 4FGL J1516.1-6429 | Δ=0.36° |
| Sun in this pixel? | False |
| Moon in this pixel? | False |
|
|
TS MAP |
COUNT MAP |
|
|
|
|
|